Fig. 8.
Download original image
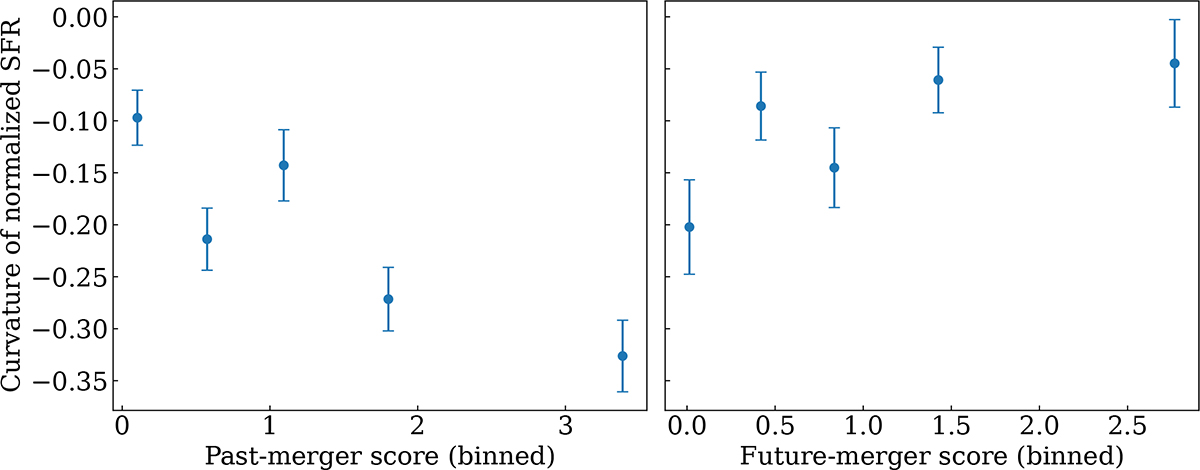
Curvature of the normalized SFR as a function of merger score. The left and right panels show results for the past- and future-merger scores, respectively. In each case, the score distribution is divided into five quantile bins. A total of 9812 samples are used in the past-merger analysis and 5609 in the future-merger case. Error bars indicate the standard error of the mean curvature within each bin.
Current usage metrics show cumulative count of Article Views (full-text article views including HTML views, PDF and ePub downloads, according to the available data) and Abstracts Views on Vision4Press platform.
Data correspond to usage on the plateform after 2015. The current usage metrics is available 48-96 hours after online publication and is updated daily on week days.
Initial download of the metrics may take a while.