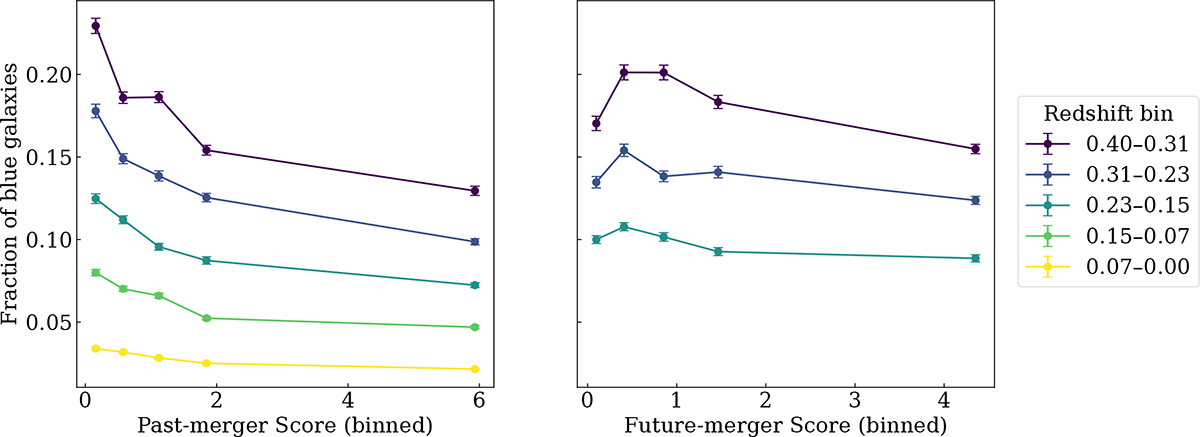
Fig. 9.
Download original image
Fraction of blue galaxies as a function of merger score, shown separately for past-merger scores (left) and future-merger scores (right). Each curve corresponds to a redshift bin defined as [zlow, zhigh), i.e., including the lower bound but excluding the upper bound. Within each redshift bin, the score distribution is divided into five quantile bins. Error bars indicate the standard error of the mean blue fraction within each merger score bin. Several redshift bins are absent in the future-merger panel due to the exclusion of low-redshift samples (z < 0.15).
Current usage metrics show cumulative count of Article Views (full-text article views including HTML views, PDF and ePub downloads, according to the available data) and Abstracts Views on Vision4Press platform.
Data correspond to usage on the plateform after 2015. The current usage metrics is available 48-96 hours after online publication and is updated daily on week days.
Initial download of the metrics may take a while.