Fig. 2.
Download original image
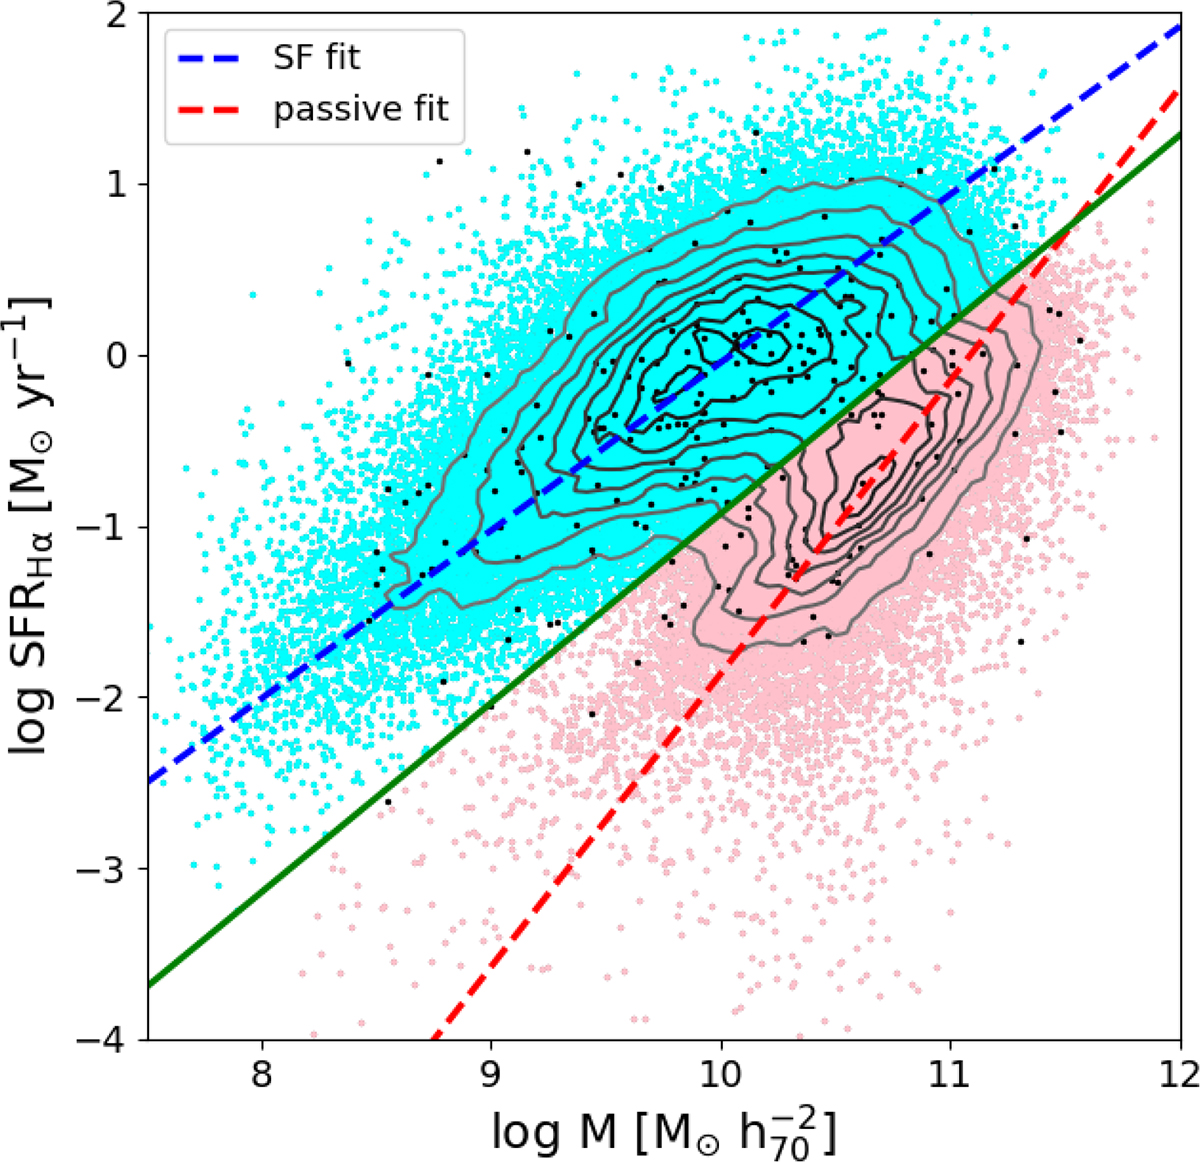
Selection of star-forming and passive galaxies using the log M − log SFR plane. The dashed blue and red lines display the star-forming and passive population fits, respectively, whereas the solid green line displays our final dividing line. Star-forming galaxies are shown in cyan and passive galaxies in pink. Black dots refer to the 242 sources with LP < −50 (Sect. 3.1).
Current usage metrics show cumulative count of Article Views (full-text article views including HTML views, PDF and ePub downloads, according to the available data) and Abstracts Views on Vision4Press platform.
Data correspond to usage on the plateform after 2015. The current usage metrics is available 48-96 hours after online publication and is updated daily on week days.
Initial download of the metrics may take a while.