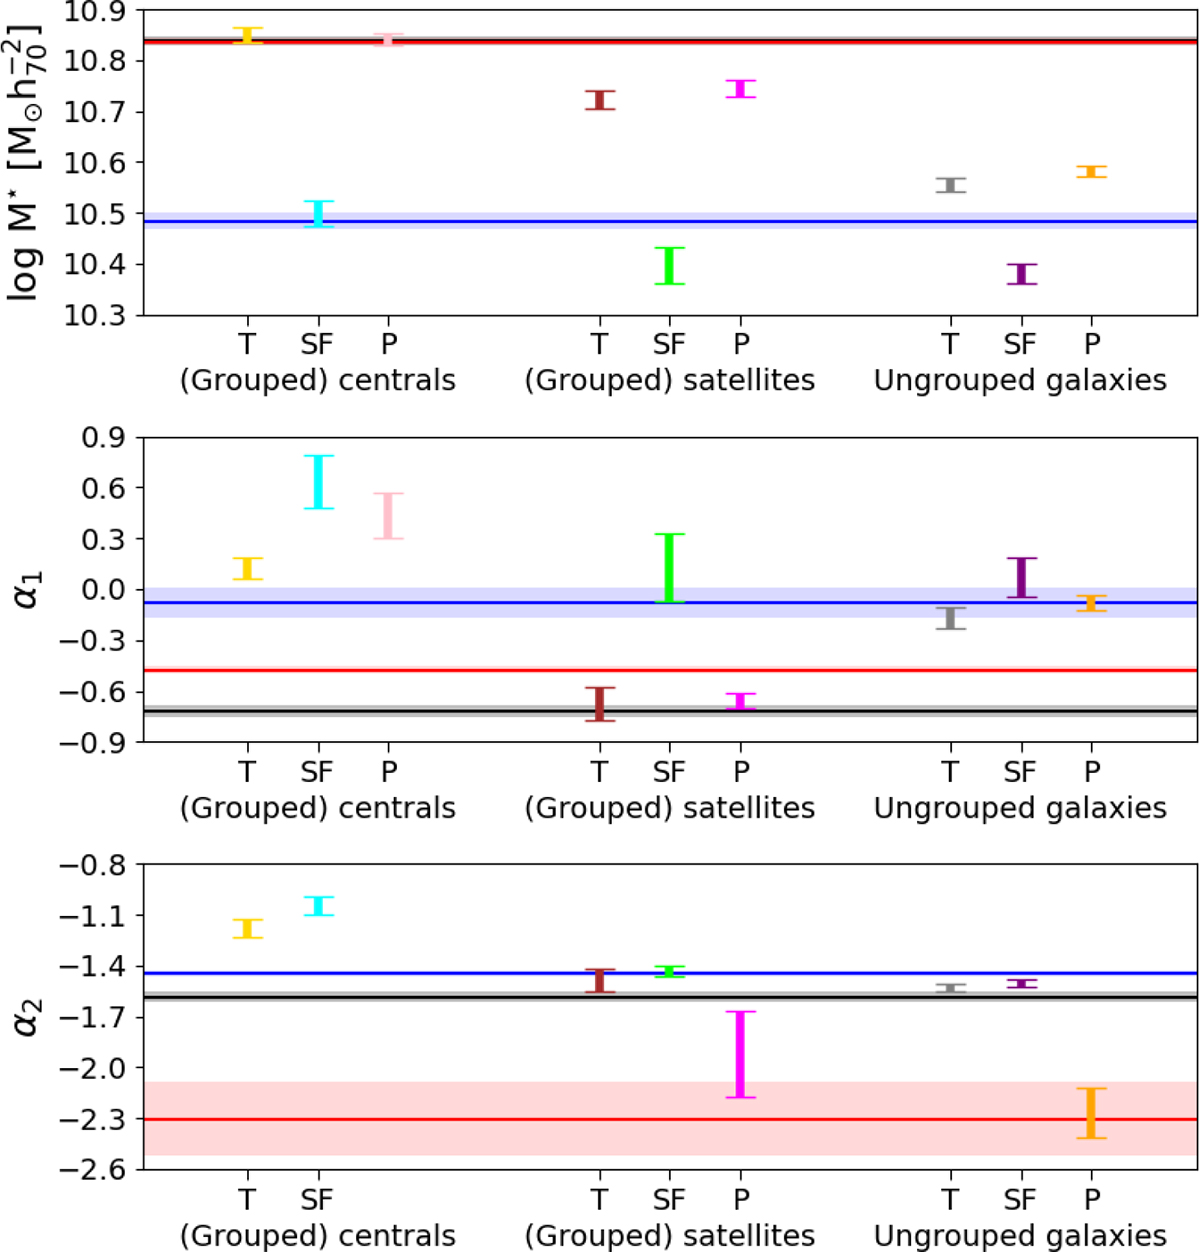
Fig. 6.
Download original image
Best-fit double Schechter function parameters of the GSMFs shown in Fig. 5, using the same colour-coding. The x-axes distinguish between central, satellite, and ungrouped galaxies; within each sample, the three ticks correspond to the total (T), star-forming (SF), and passive (P) subsamples. The black, blue and red horizontal bands show the results for the full parent, all-star-forming and all-passive samples, respectively, taken from Fig. 4. These reference lines are meant to be compared only with the T, SF, and P values in each subsample, respectively. Corresponding corner plots illustrating the correlations among fitted parameters are provided in Figs. A.4 and A.5.
Current usage metrics show cumulative count of Article Views (full-text article views including HTML views, PDF and ePub downloads, according to the available data) and Abstracts Views on Vision4Press platform.
Data correspond to usage on the plateform after 2015. The current usage metrics is available 48-96 hours after online publication and is updated daily on week days.
Initial download of the metrics may take a while.