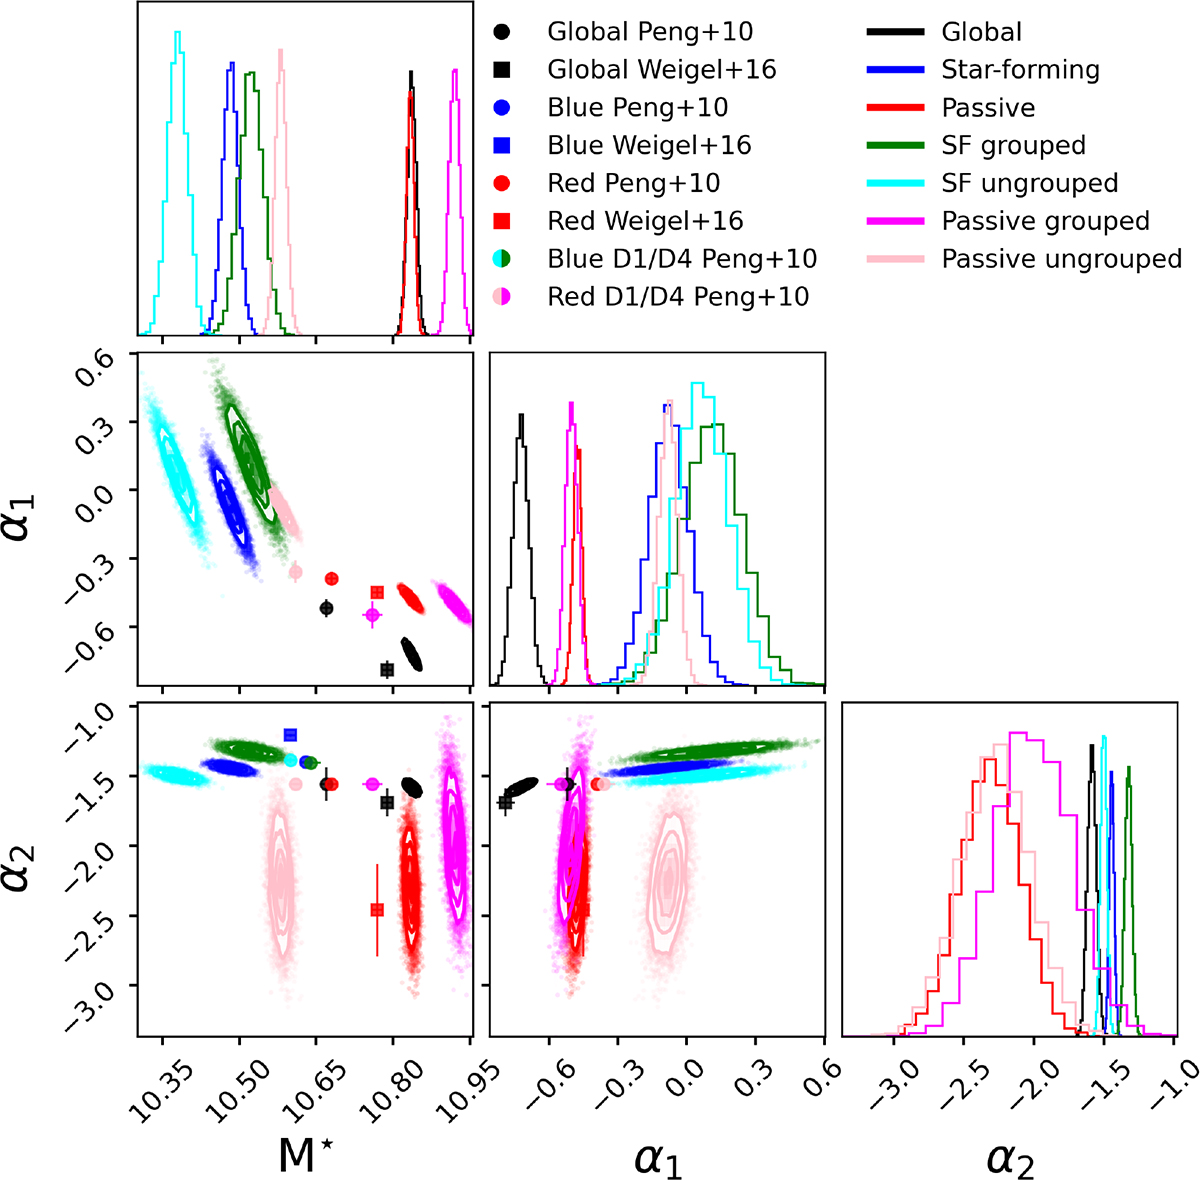
Fig. 9.
Download original image
Comparison between our best-fit double Schechter function parameters and literature values for different subsamples, as indicated in the legend. The likelihood contours show the 1σ, 2σ, and 3σ confidence regions for our fits. For each distribution, 104 random samples were generated. Symbols indicate the best-fit values from previous studies: circles for Peng et al. (2010) and squares for Weigel et al. (2016).
Current usage metrics show cumulative count of Article Views (full-text article views including HTML views, PDF and ePub downloads, according to the available data) and Abstracts Views on Vision4Press platform.
Data correspond to usage on the plateform after 2015. The current usage metrics is available 48-96 hours after online publication and is updated daily on week days.
Initial download of the metrics may take a while.