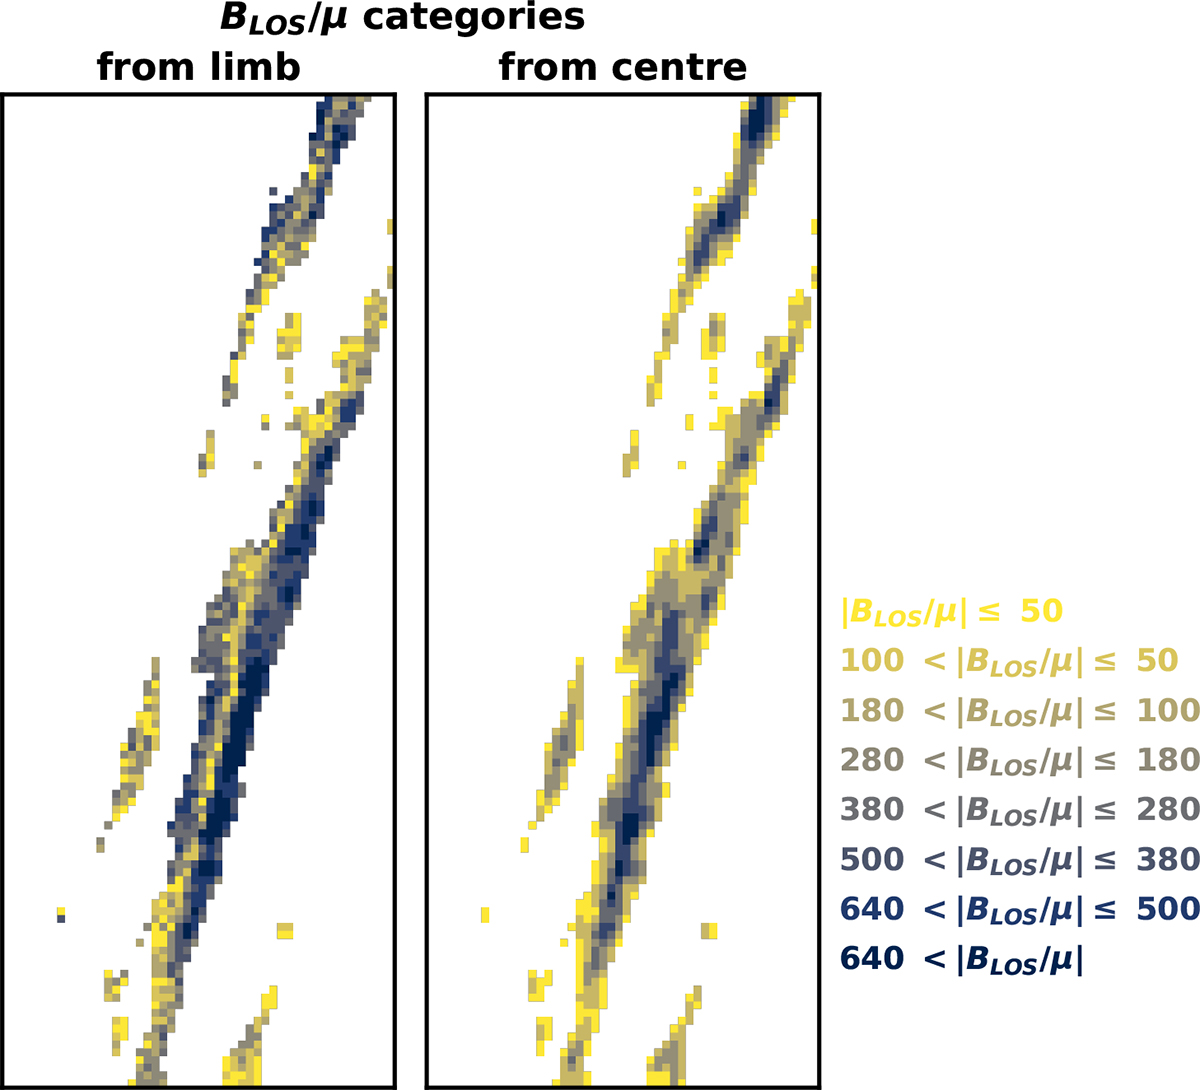
Fig. 10.
Download original image
Sub-region of the first dataset pair in the study, illustrating the change in BLOS category of facular pixels between vantage points. Left: Limb view. Right: Disc-centre view. The categories (a to h in Fig. C.1) are assigned colours ranging from blue to yellow, which are used to colour the pixels in the images. Same region as in Figure 9.
Current usage metrics show cumulative count of Article Views (full-text article views including HTML views, PDF and ePub downloads, according to the available data) and Abstracts Views on Vision4Press platform.
Data correspond to usage on the plateform after 2015. The current usage metrics is available 48-96 hours after online publication and is updated daily on week days.
Initial download of the metrics may take a while.