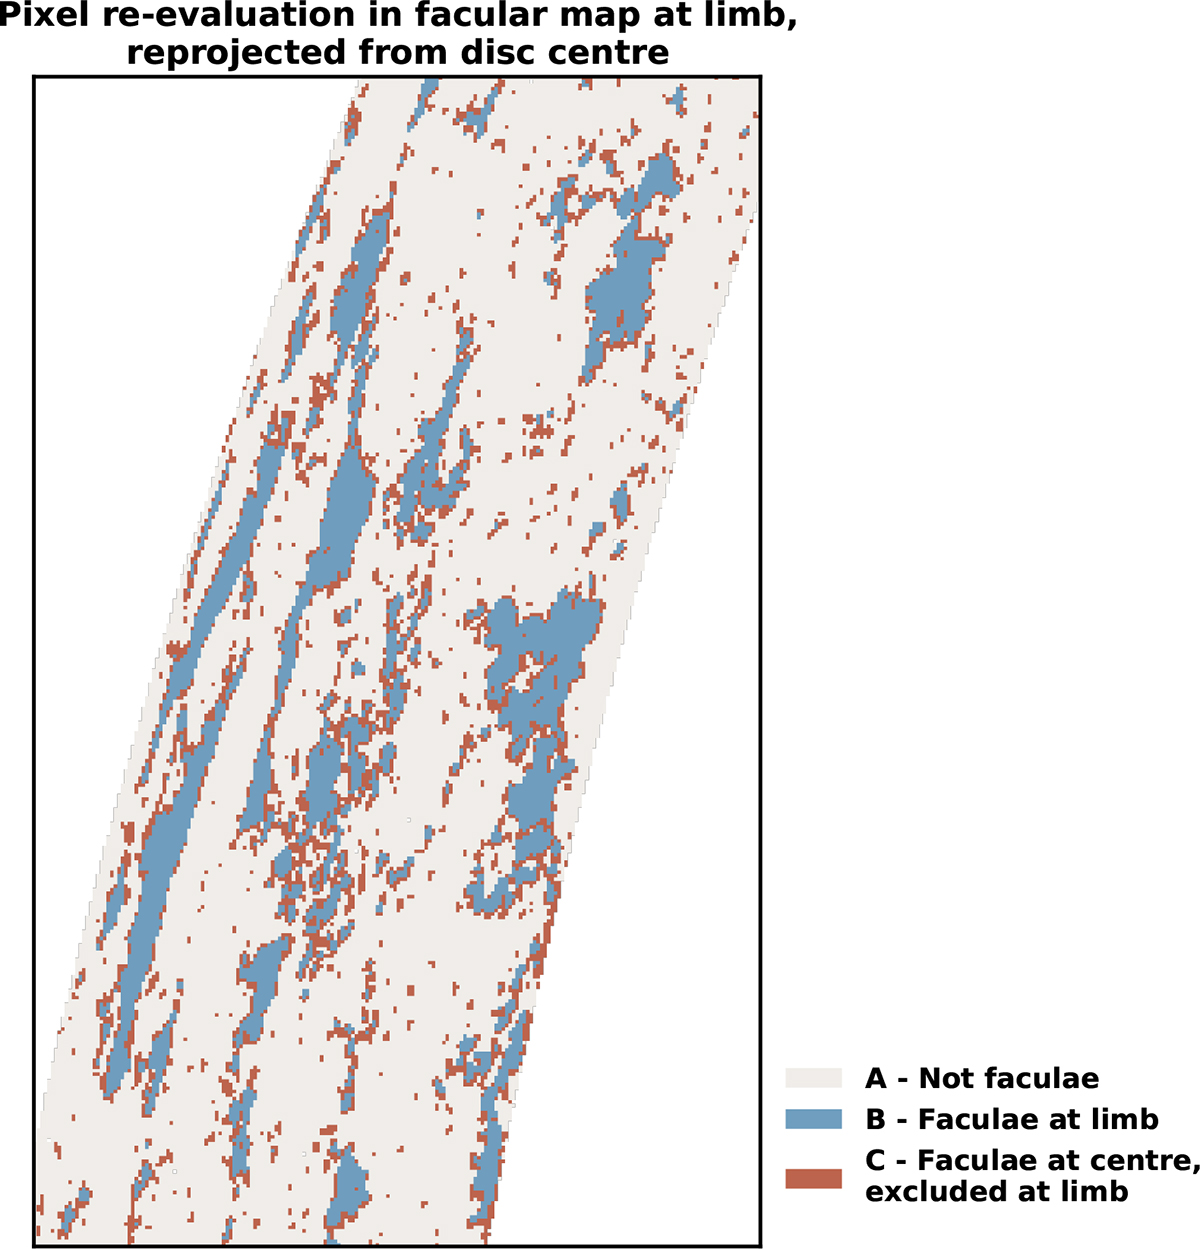
Fig. A.1.
Download original image
A sub-region of the first dataset in this study (same as in Fig. 4), showing the facular map determined at disc centre by SO/PHI-HRT and reprojected onto the reference frame of SDO/HMI. After re-projection, an additional selection criterion is applied: only those facular pixels are kept, for which the reprojected BLOS/μ, originally measured at disc centre, exceeds three times the noise level of SDO/HMI at the limb. Pixels meeting this criterion are shown in colour B, while those excluded from the analysis are shown in colour C.
Current usage metrics show cumulative count of Article Views (full-text article views including HTML views, PDF and ePub downloads, according to the available data) and Abstracts Views on Vision4Press platform.
Data correspond to usage on the plateform after 2015. The current usage metrics is available 48-96 hours after online publication and is updated daily on week days.
Initial download of the metrics may take a while.