Fig. B.1.
Download original image
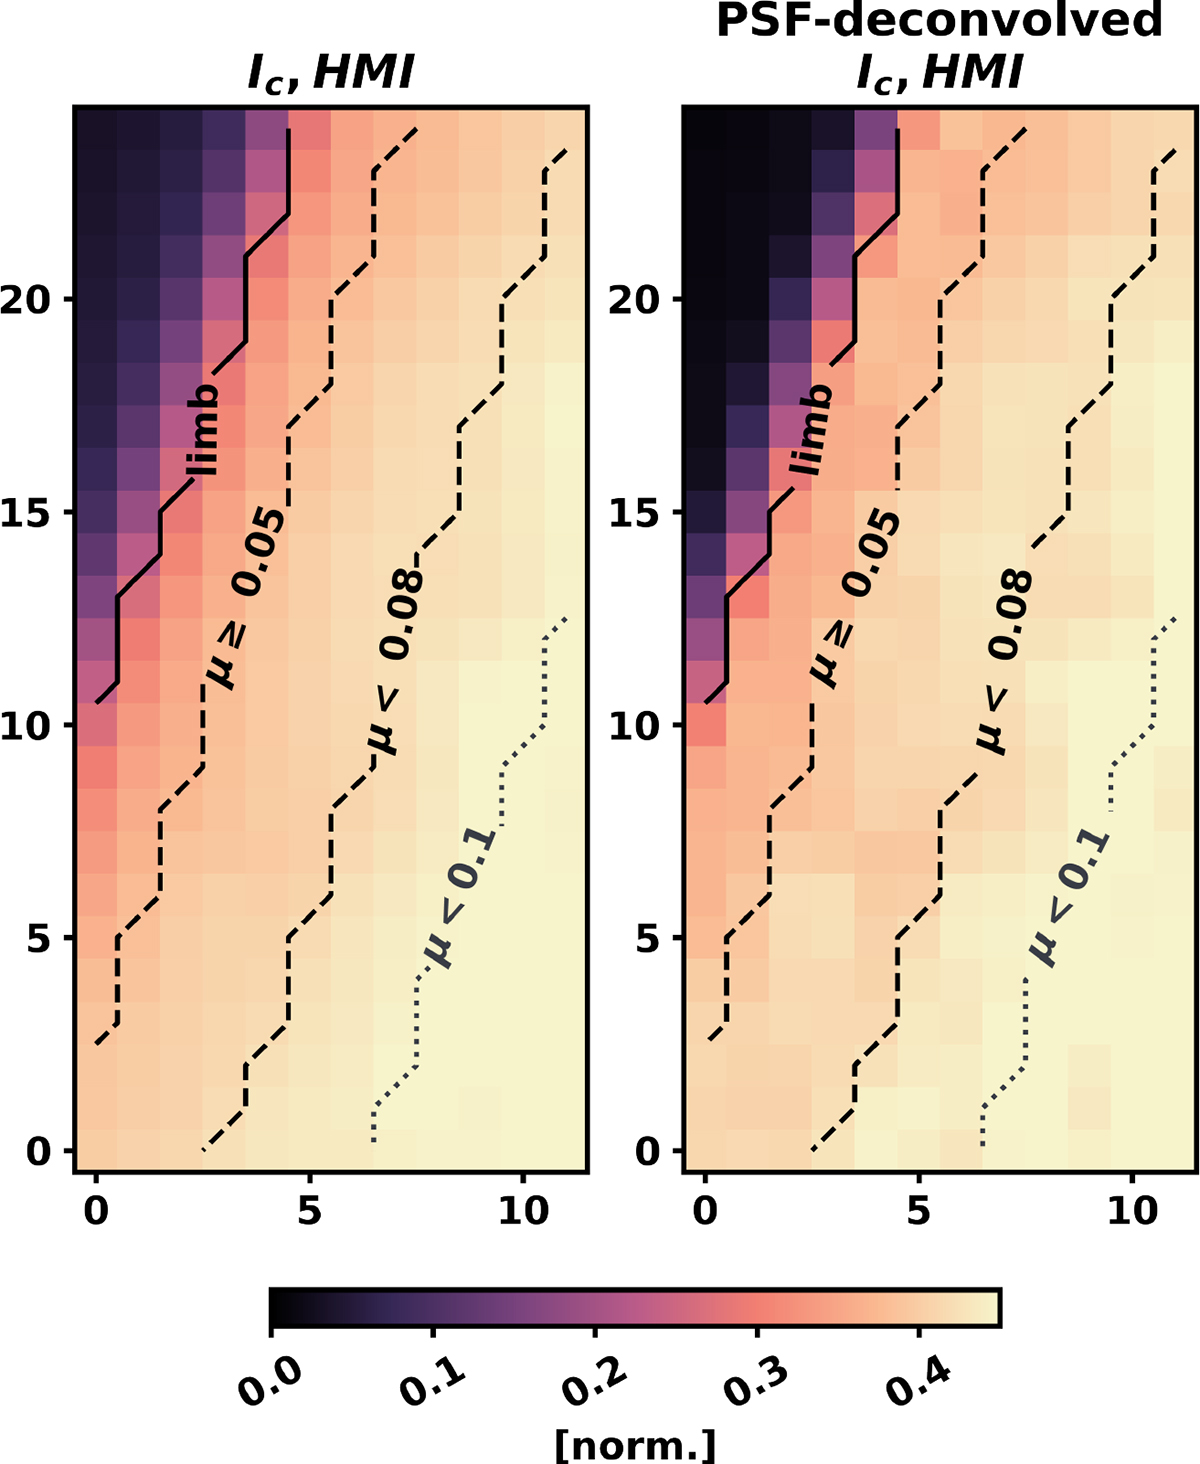
Close-up of SDO/HMI continuum intensity pixels near the solar limb. Left: Continuum intensity from the hmi.Ic_45s data product, normalised to the mean intensity at disc centre. Right: Corresponding normalised intensity after PSF deconvolution, from the hmi.Ic_45s_dcon data product. The associated μ values are computed from the metadata of the hmi.Ic_45s data product. The solid line marks the solar limb; dashed lines indicate the outermost bin-width (used in Fig. 6); and the dotted line shows the μ = 0.1 contour for reference.
Current usage metrics show cumulative count of Article Views (full-text article views including HTML views, PDF and ePub downloads, according to the available data) and Abstracts Views on Vision4Press platform.
Data correspond to usage on the plateform after 2015. The current usage metrics is available 48-96 hours after online publication and is updated daily on week days.
Initial download of the metrics may take a while.