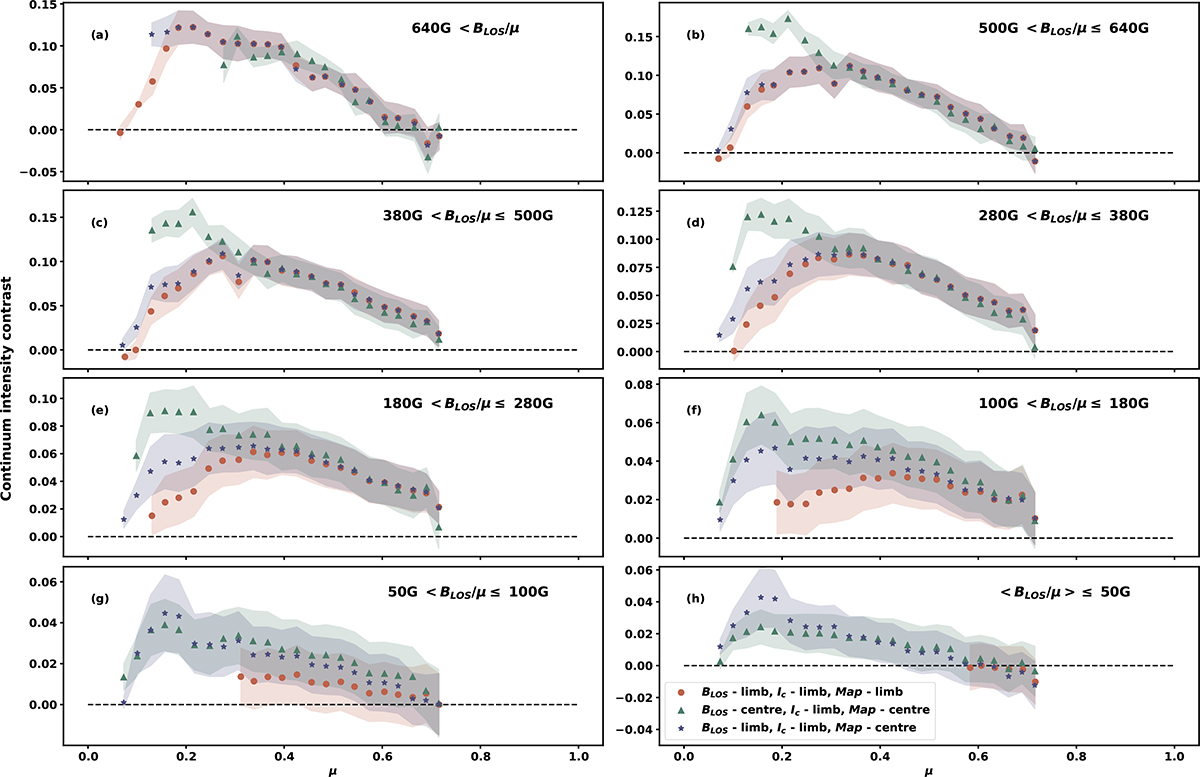
Fig. C.1.
Download original image
Same relationship as shown in Fig. 6, but limited to data in the common field-of-view of SDO/HMI and SO/PHI, which falls between 0.05 < μ < 0.75. Consequently, the orange curve now uses much less data than that shown in Fig. 6, and therefore has more limited statistics, but it is calculated in the same way as the one in Fig. 6. The green curve (double-viewpoint approach) remains unchanged. An additional blue curve is included, representing the facular contrast derived from both Ic and BLOS measured at the limb, but using pixels selected from the facular map derived at disc centre. Markers and shaded areas have the same meaning as in Fig. 6.
Current usage metrics show cumulative count of Article Views (full-text article views including HTML views, PDF and ePub downloads, according to the available data) and Abstracts Views on Vision4Press platform.
Data correspond to usage on the plateform after 2015. The current usage metrics is available 48-96 hours after online publication and is updated daily on week days.
Initial download of the metrics may take a while.