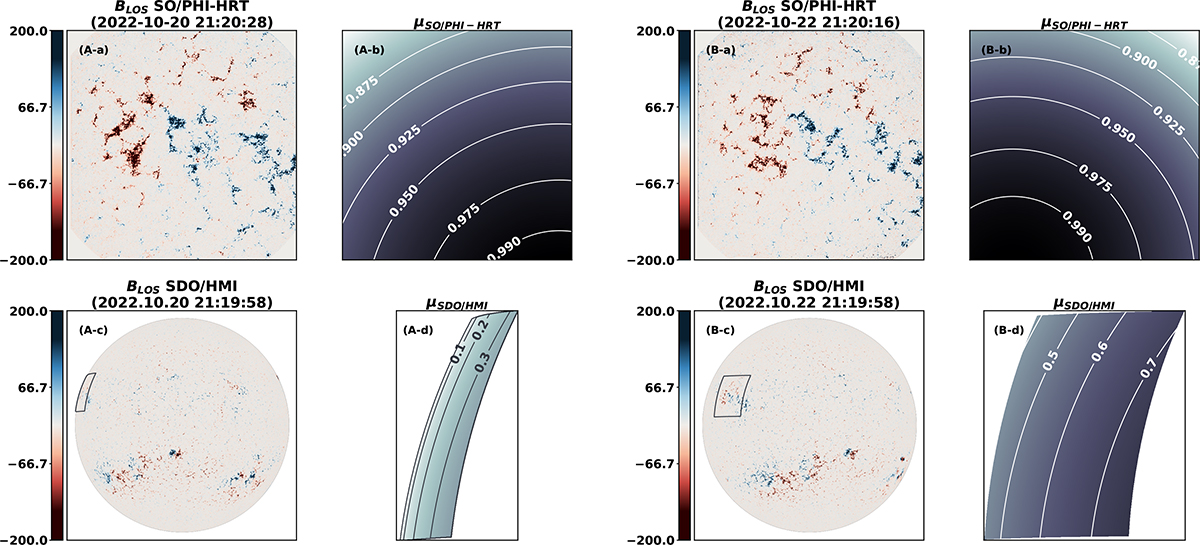
Fig. 2.
Download original image
First and last dataset pairs used in this study, from 20 and 22 October 2022 (A and B, respectively). Top: BLOS and μ of a facular region near disc centre (a and b). Bottom: BLOS and μ of same region, as seen simultaneously by SDO/HMI (c and d). The contour shows the location of the SO/PHI field of view, and the μ in the SDO/HMI view-point is shown only for the contoured region.
Current usage metrics show cumulative count of Article Views (full-text article views including HTML views, PDF and ePub downloads, according to the available data) and Abstracts Views on Vision4Press platform.
Data correspond to usage on the plateform after 2015. The current usage metrics is available 48-96 hours after online publication and is updated daily on week days.
Initial download of the metrics may take a while.