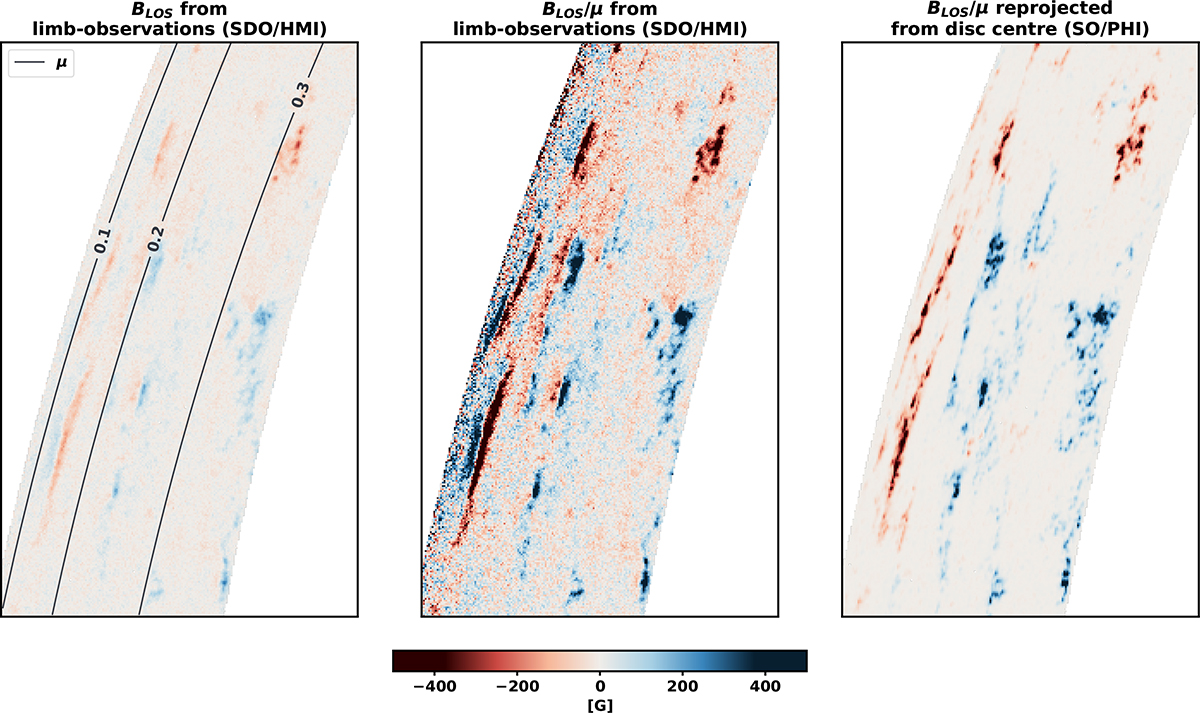
Fig. 4.
Download original image
Sub-region of first dataset pair in time series used in the study, showing BLOS derived from the limb observation by SDO/HMI (first panel), the same data divided by μ (BLOS/μ, second panel), and BLOS derived from disc centre by SO/PHI-HRT; these are divided by the μ value of the disc-centre view and re-projected to the limb to match the reference frame of SDO/HMI (third panel).
Current usage metrics show cumulative count of Article Views (full-text article views including HTML views, PDF and ePub downloads, according to the available data) and Abstracts Views on Vision4Press platform.
Data correspond to usage on the plateform after 2015. The current usage metrics is available 48-96 hours after online publication and is updated daily on week days.
Initial download of the metrics may take a while.