Fig. 5.
Download original image
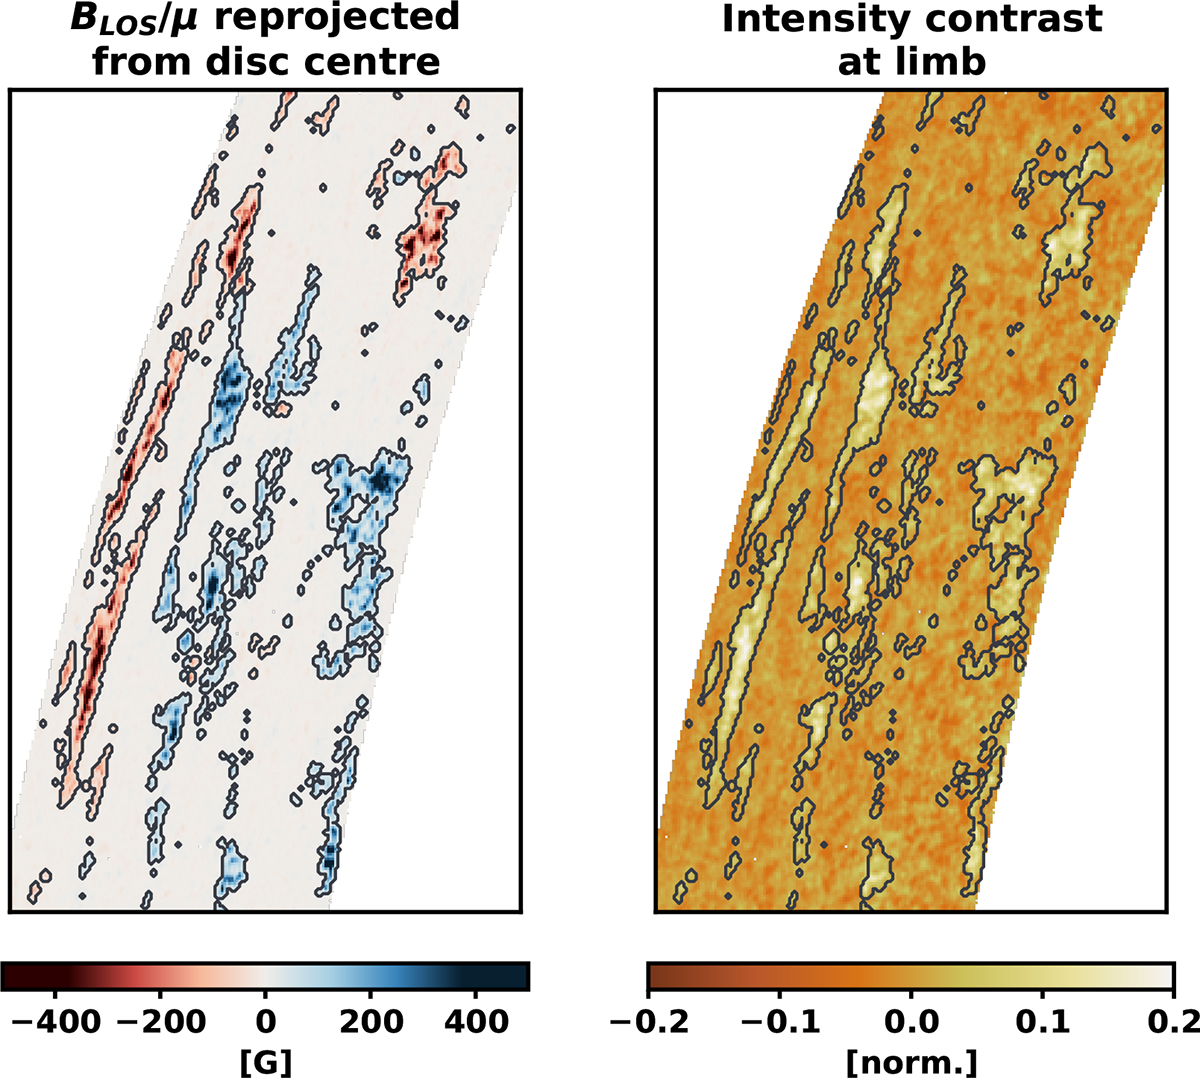
Data combined in our analysis from different viewing angles. Left: BLOS derived at disc centre from SO/PHI-HRT observations, normalised by the local μ at which it was observed and reprojected to the limb. Right: Intensity contrast is computed from SDO/HMI Ic data at the limb. Contours: We identified facular pixels at disc centre in SO/PHI-HRT observations and then re-projected this map to the limb. The same sub-region as in Fig. 4 is shown.
Current usage metrics show cumulative count of Article Views (full-text article views including HTML views, PDF and ePub downloads, according to the available data) and Abstracts Views on Vision4Press platform.
Data correspond to usage on the plateform after 2015. The current usage metrics is available 48-96 hours after online publication and is updated daily on week days.
Initial download of the metrics may take a while.