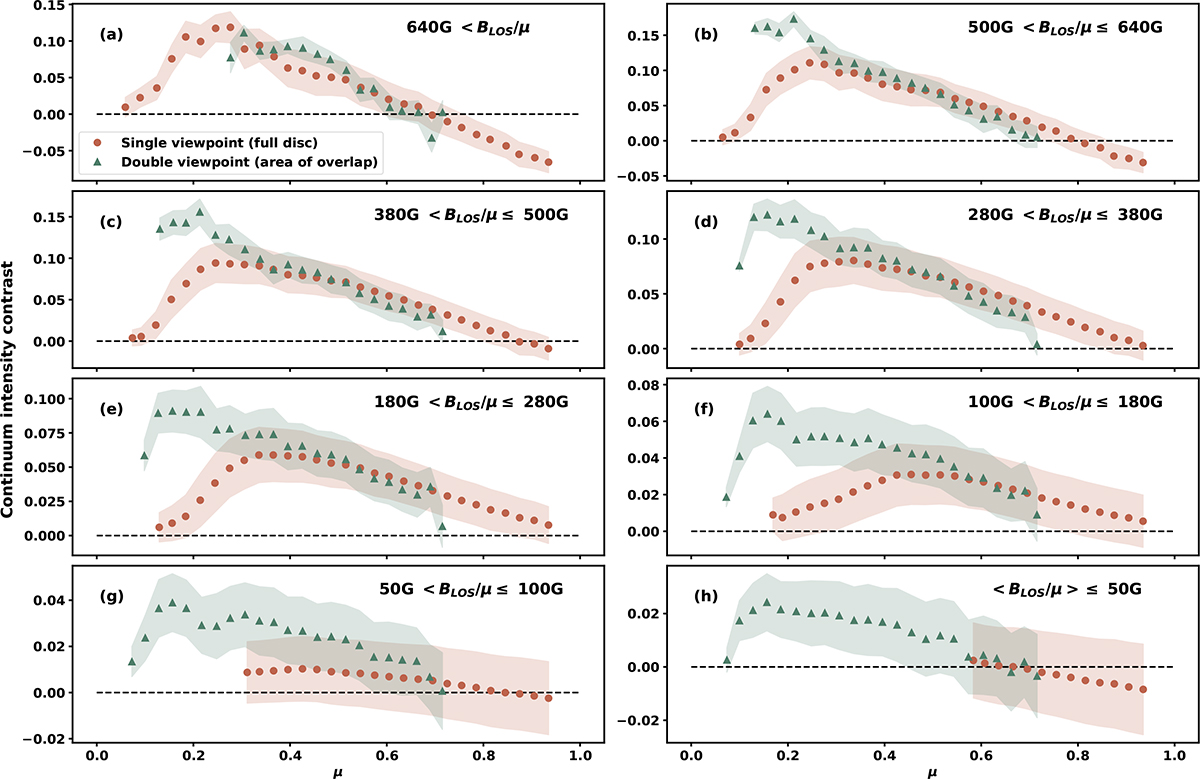
Fig. 6.
Download original image
Relationship between facular intensity contrast and μ. Panels (a)–(h) show pixels grouped by their associated BLOS/μ values. Points represent the mean intensity contrast in μ bins of width 0.03; shaded areas indicate the standard deviation within each bin. Orange dots correspond to a single-viewpoint analysis using SDO/HMI data from the full disc. Green triangles represent results from the dual-viewpoint approach, combining SO/PHI-HRT observations at the disc centre with SDO/HMI observations near the limb in the region of overlap. Note that the y-axis limits differ between panels.
Current usage metrics show cumulative count of Article Views (full-text article views including HTML views, PDF and ePub downloads, according to the available data) and Abstracts Views on Vision4Press platform.
Data correspond to usage on the plateform after 2015. The current usage metrics is available 48-96 hours after online publication and is updated daily on week days.
Initial download of the metrics may take a while.