Open Access
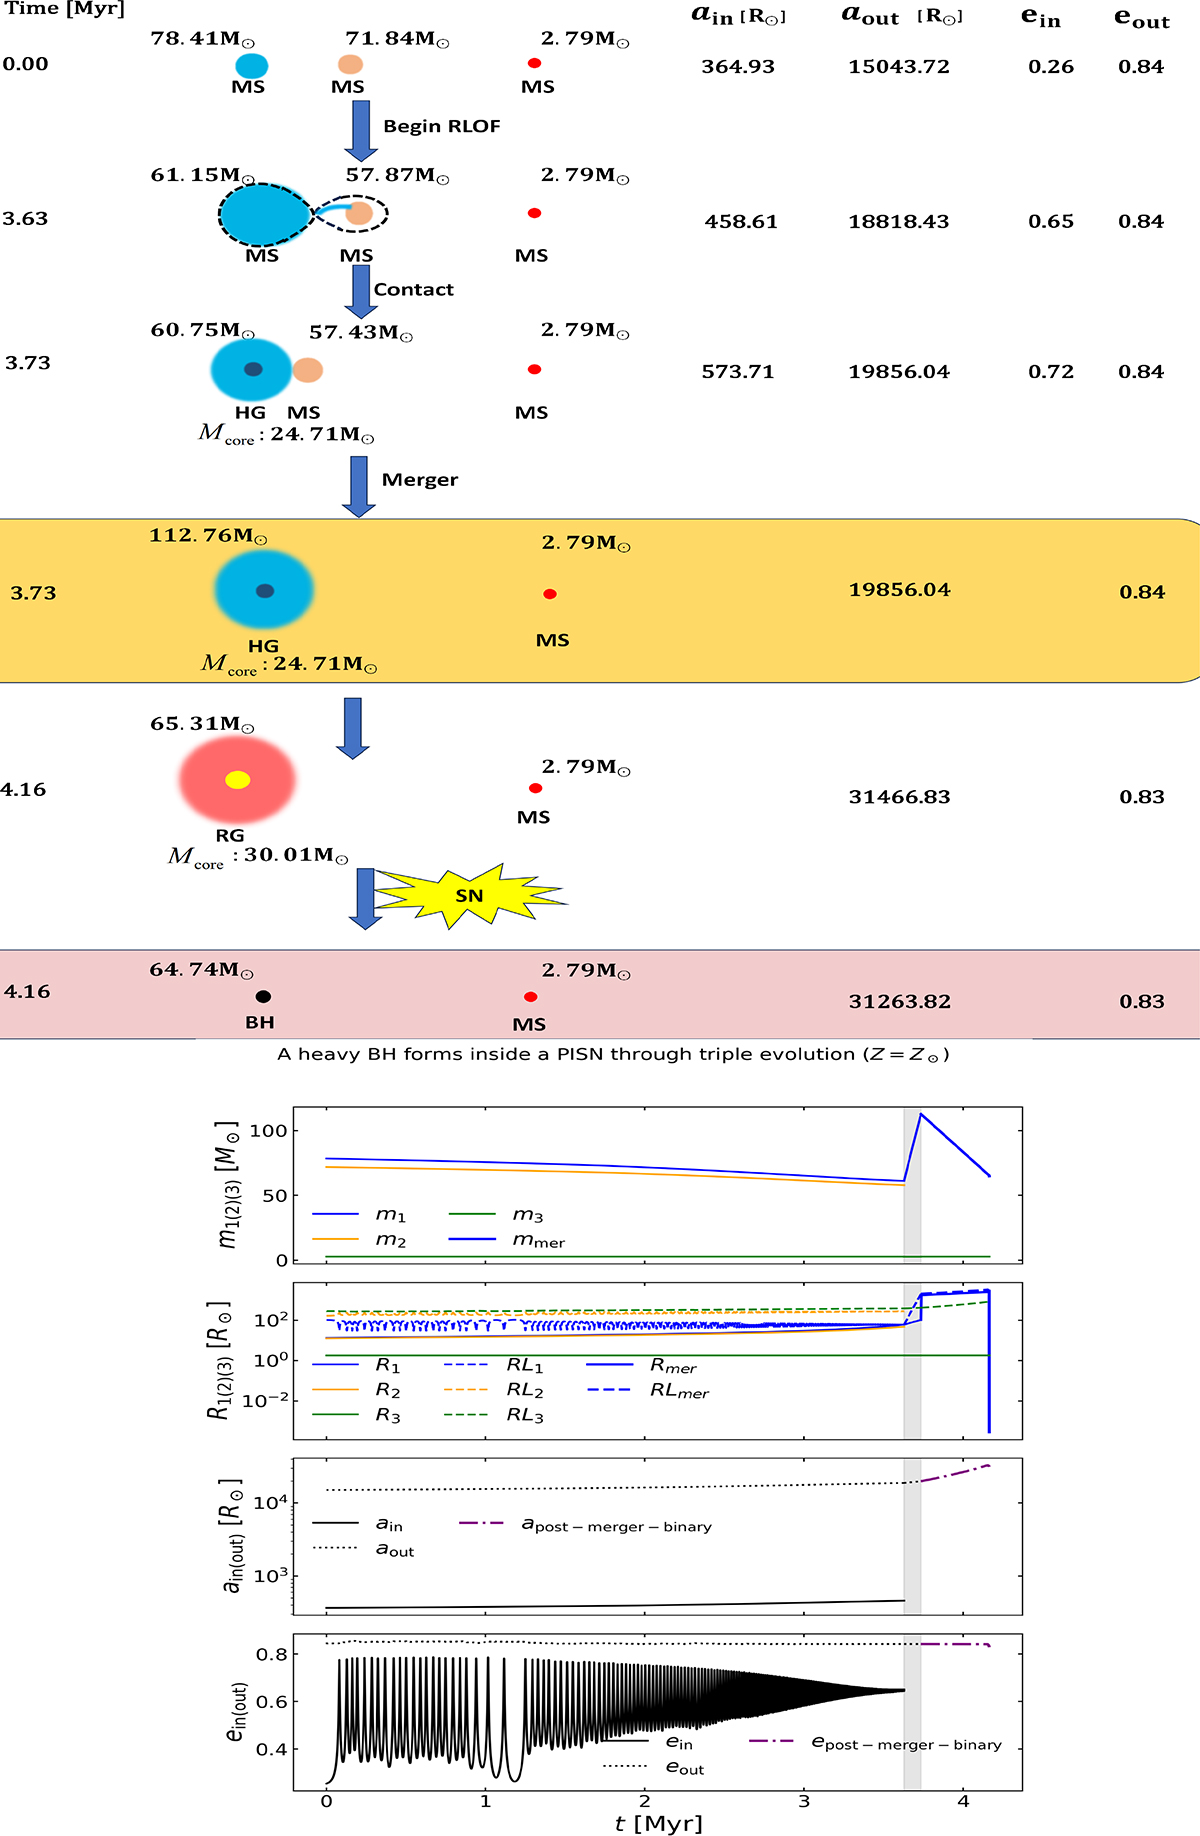
Fig. 6.
Download original image
Example of a dBH-LC with a BH in the PISN range formed through triple evolution. In the upper panel, the yellow area and the red area represent the formation of the post-merger binary and the formation of the dBH-LC, respectively. In the lower panel, the gray area represents the phase when the inner binary undergoes MT.
Current usage metrics show cumulative count of Article Views (full-text article views including HTML views, PDF and ePub downloads, according to the available data) and Abstracts Views on Vision4Press platform.
Data correspond to usage on the plateform after 2015. The current usage metrics is available 48-96 hours after online publication and is updated daily on week days.
Initial download of the metrics may take a while.