Open Access
Fig. A.3.
Download original image
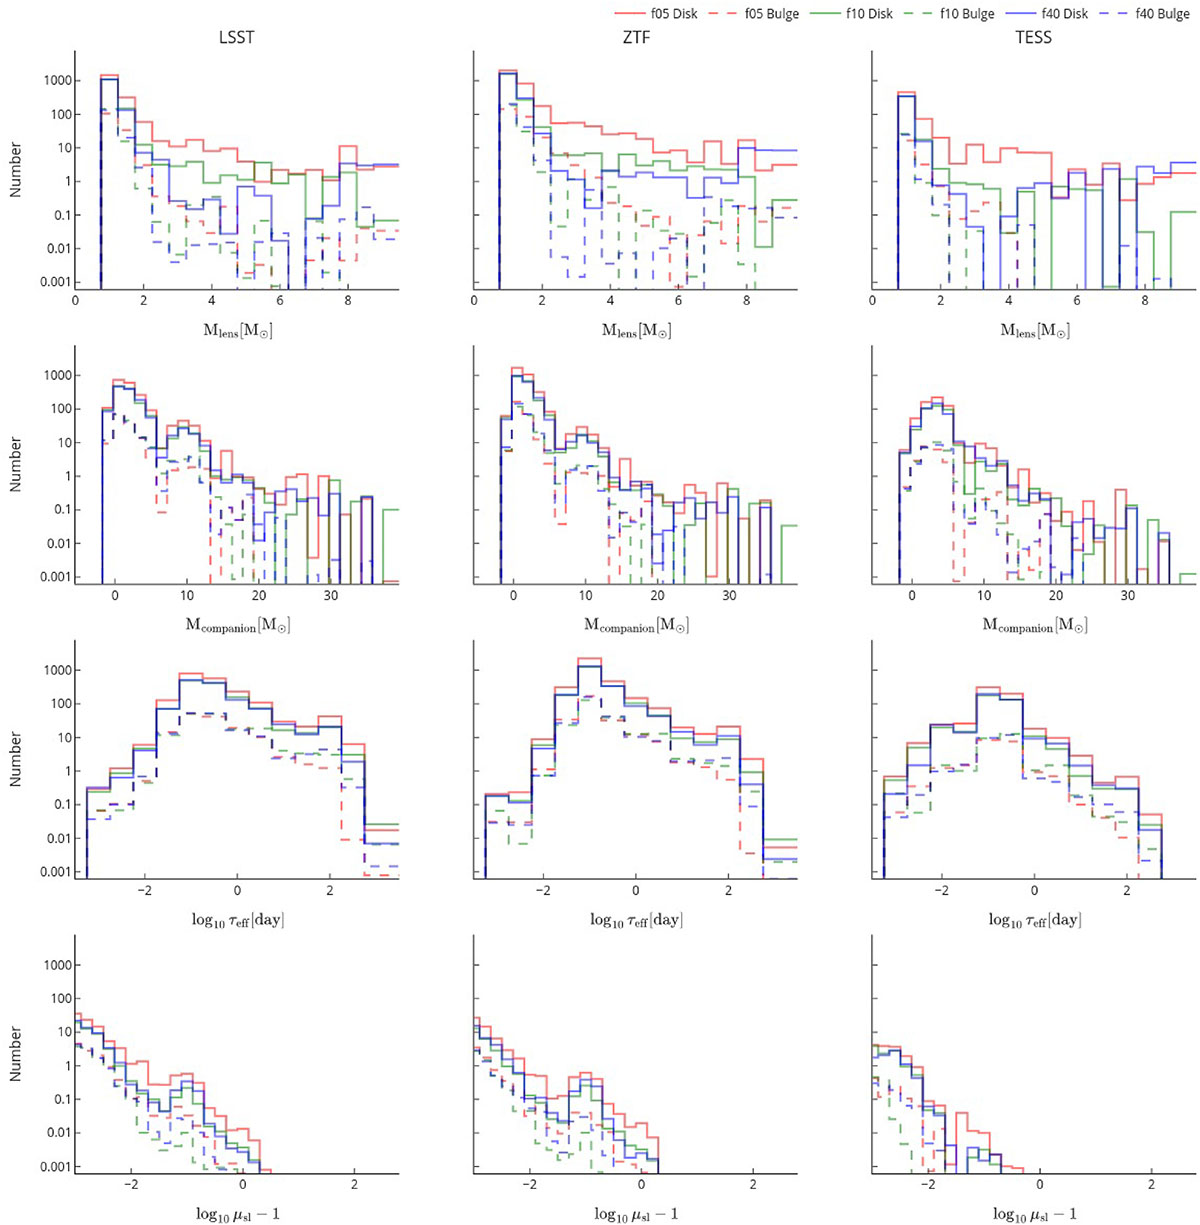
Parameter distributions for SL binaries with lens masses in the ’mass gap’ region. The plotted lens mass (Mlens) range is restricted to 0–10M⊙ to highlight differences in the mass gap (2–5M⊙). All other aspects are identical to Fig. A.1.
Current usage metrics show cumulative count of Article Views (full-text article views including HTML views, PDF and ePub downloads, according to the available data) and Abstracts Views on Vision4Press platform.
Data correspond to usage on the plateform after 2015. The current usage metrics is available 48-96 hours after online publication and is updated daily on week days.
Initial download of the metrics may take a while.