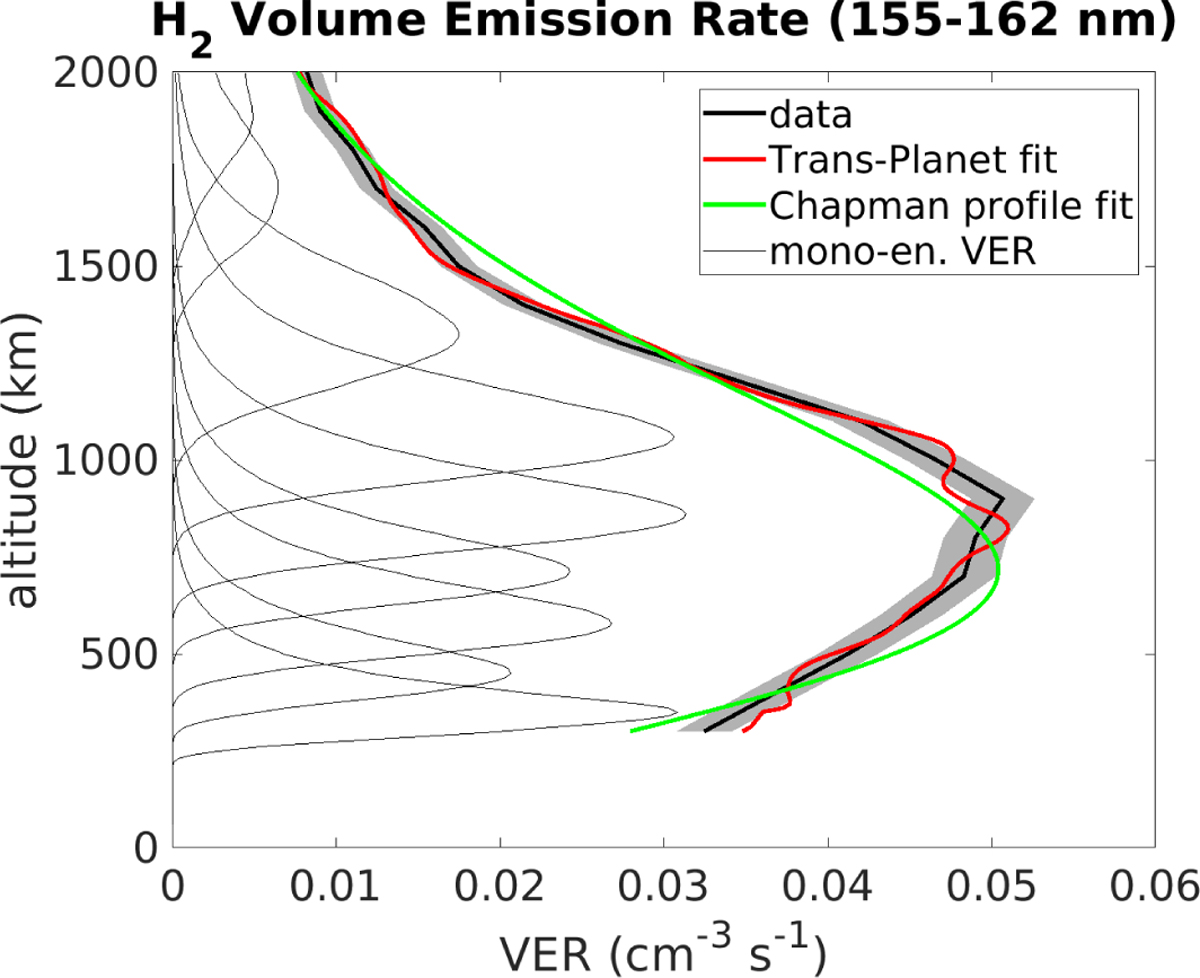
Fig. 2
Download original image
Volume emission rate corresponding to the average brightness of the Io tail between 3 and 10 degrees, extracted from the observations during PJ 40 (see Fig. 1) using Eq. (5). The black solid line is the extracted profile with the associated uncertainty (gray area). The green line is the fit using a Chapman function Eq. (9) (Bonfond 2010), and the red line is the fit using the linear combination in Eq. (6) computed from TransPlanet. The thin black lines show the individual volume emission rates obtained from mono-energetic electron precipitations with an energy of 0.05, 0.1, 0.4, 1, 2, 4, 8, 16, and 32 keV (from high to low altitudes). The profile below 300 km was excluded, as the volume emission rates generated by precipitations with energy ≳50 keV peak below that altitude and undersample the profile at a spatial resolution of ~ 100 km.
Current usage metrics show cumulative count of Article Views (full-text article views including HTML views, PDF and ePub downloads, according to the available data) and Abstracts Views on Vision4Press platform.
Data correspond to usage on the plateform after 2015. The current usage metrics is available 48-96 hours after online publication and is updated daily on week days.
Initial download of the metrics may take a while.