Fig. 3
Download original image
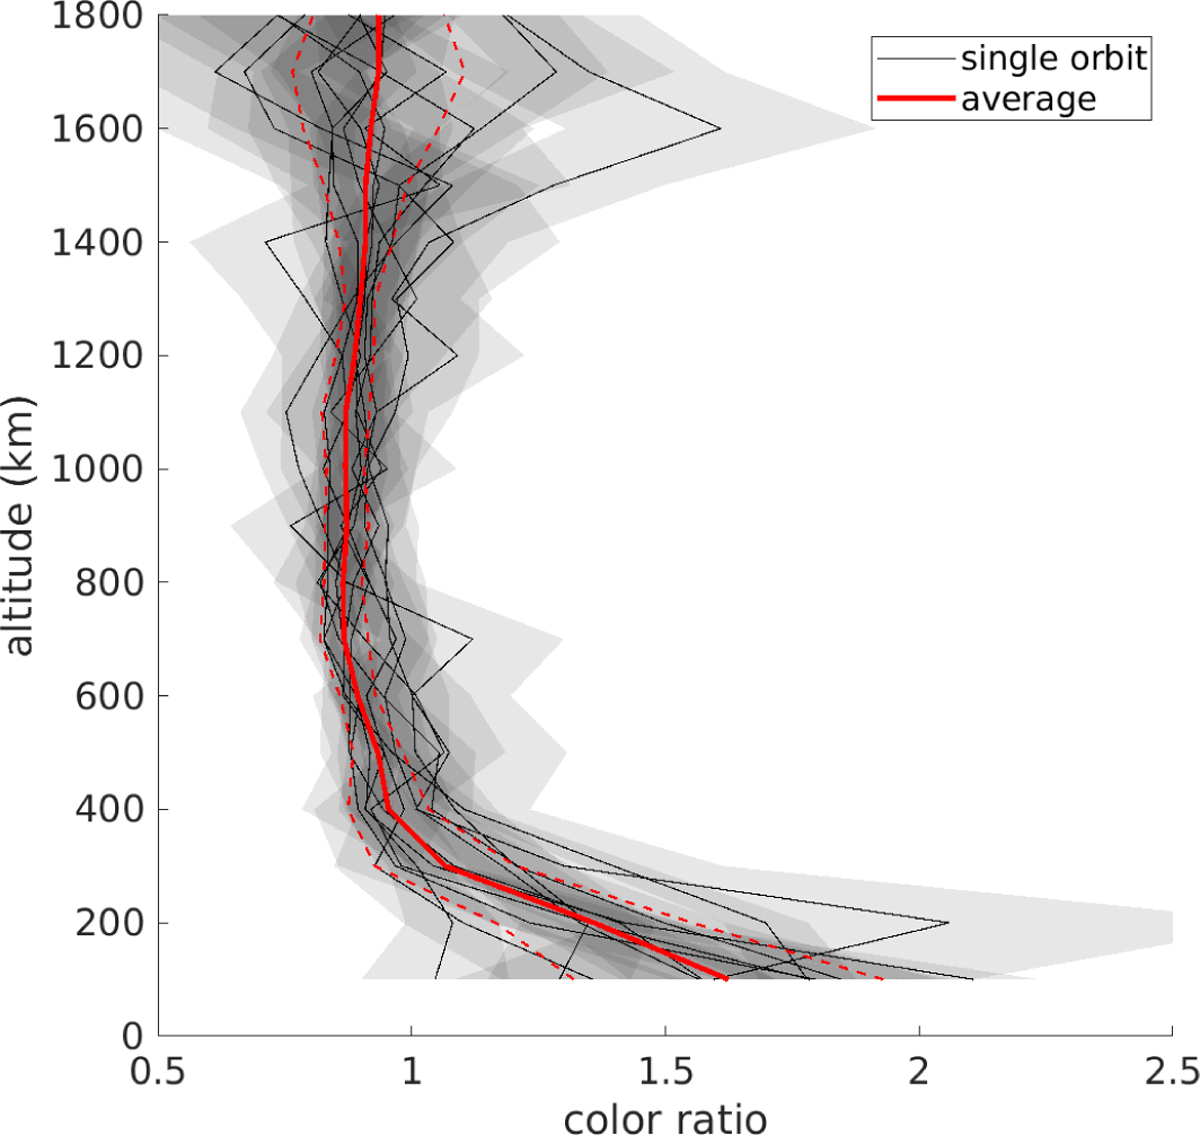
Color ratio obtained from the vertical brightness profile of the IFP between 3 and 10 degrees with Eq. (8). The black lines are the orbit-by-orbit color ratios with their respective uncertainty (gray areas). The red solid curve is the average color ratio, and the red dashed lines are the 1σ boundary of its uncertainty. The data below 100 km were excluded due to poor S/N.
Current usage metrics show cumulative count of Article Views (full-text article views including HTML views, PDF and ePub downloads, according to the available data) and Abstracts Views on Vision4Press platform.
Data correspond to usage on the plateform after 2015. The current usage metrics is available 48-96 hours after online publication and is updated daily on week days.
Initial download of the metrics may take a while.