Fig. 4
Download original image
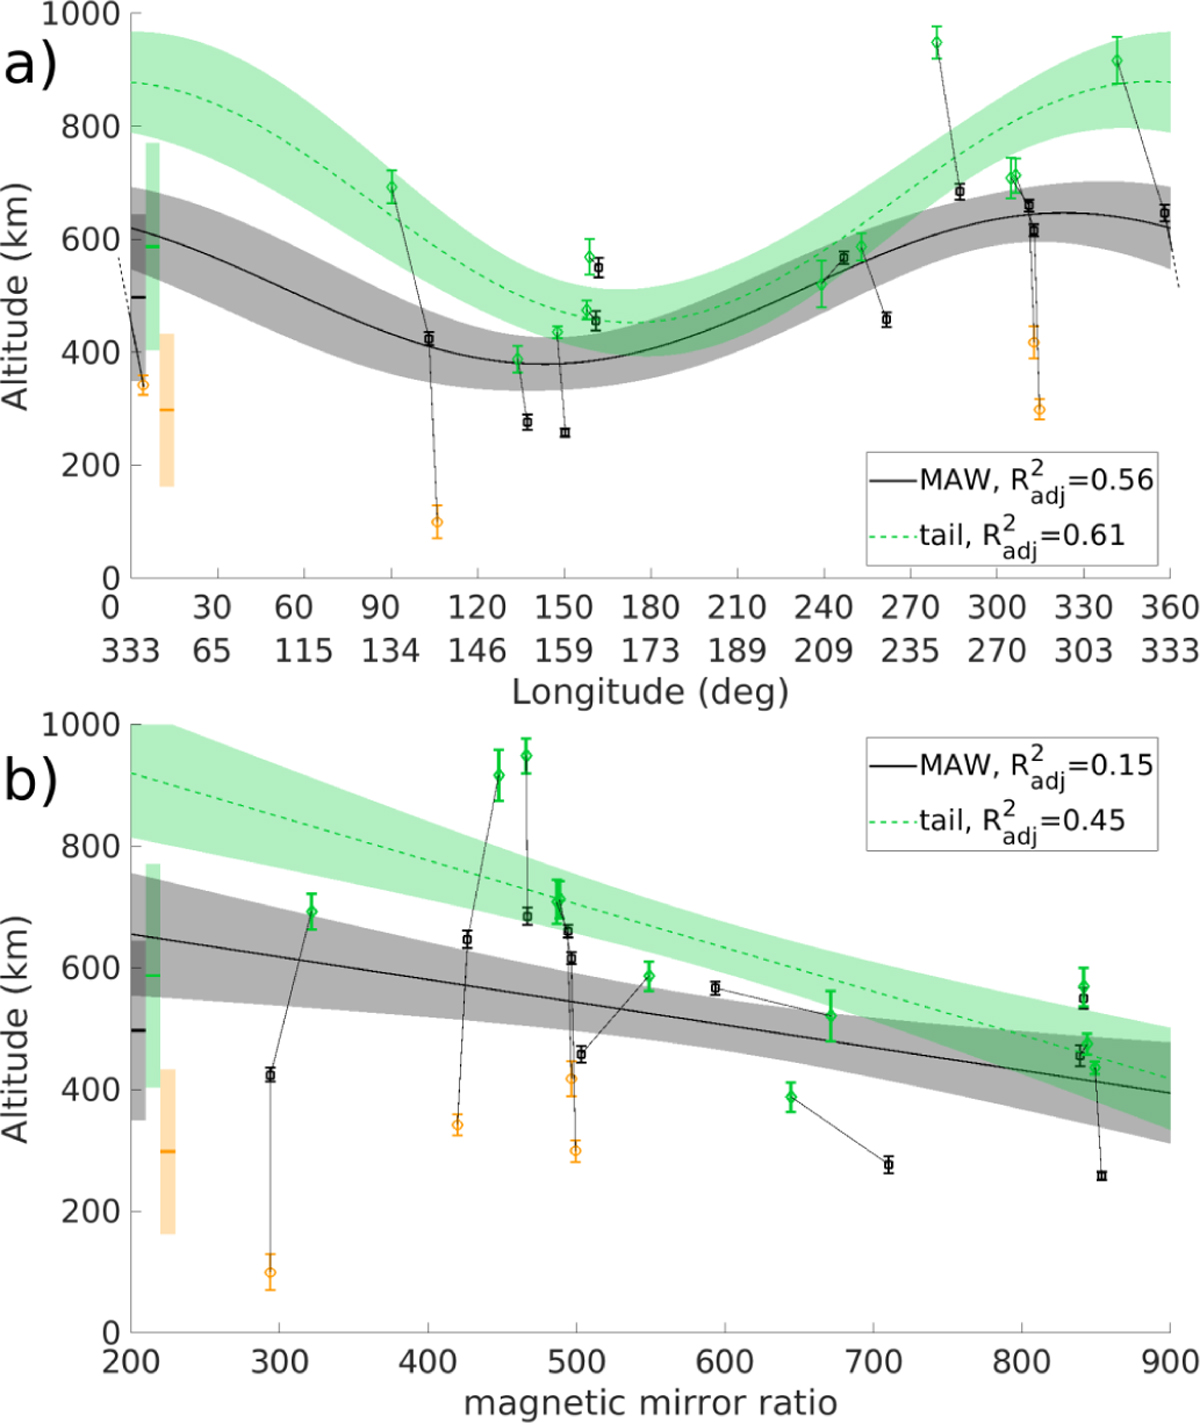
Altitude of the peak emission of the MAW spot (black squares), the IFP tail (green diamonds), and the TEB spot (orange circles) as a function of longitude (panel a) and the magnetic mirror ratio (panel b). The double longitude labels indicate the footprint (top) and moon longitudes (bottom), respectively. The data points are obtained from Juno-UVS, and the error bars are 1σ. For the MAW spot data, the solid black lines are a sinusoidal fit in panel a and a linear fit in panels b, respectively. The green dashed lines are the same type of fit, but for the tail data. The thin black lines connecting MAW and TEB tail points link data from the same Juno orbit (note that the MAW spot around 360 degrees is associated with the TEB spot near 0 degrees). The gray, green, and orange bars attached to the y axis show the average altitude of the three features and their respective standard deviations.
Current usage metrics show cumulative count of Article Views (full-text article views including HTML views, PDF and ePub downloads, according to the available data) and Abstracts Views on Vision4Press platform.
Data correspond to usage on the plateform after 2015. The current usage metrics is available 48-96 hours after online publication and is updated daily on week days.
Initial download of the metrics may take a while.