Open Access
Fig. 8
Download original image
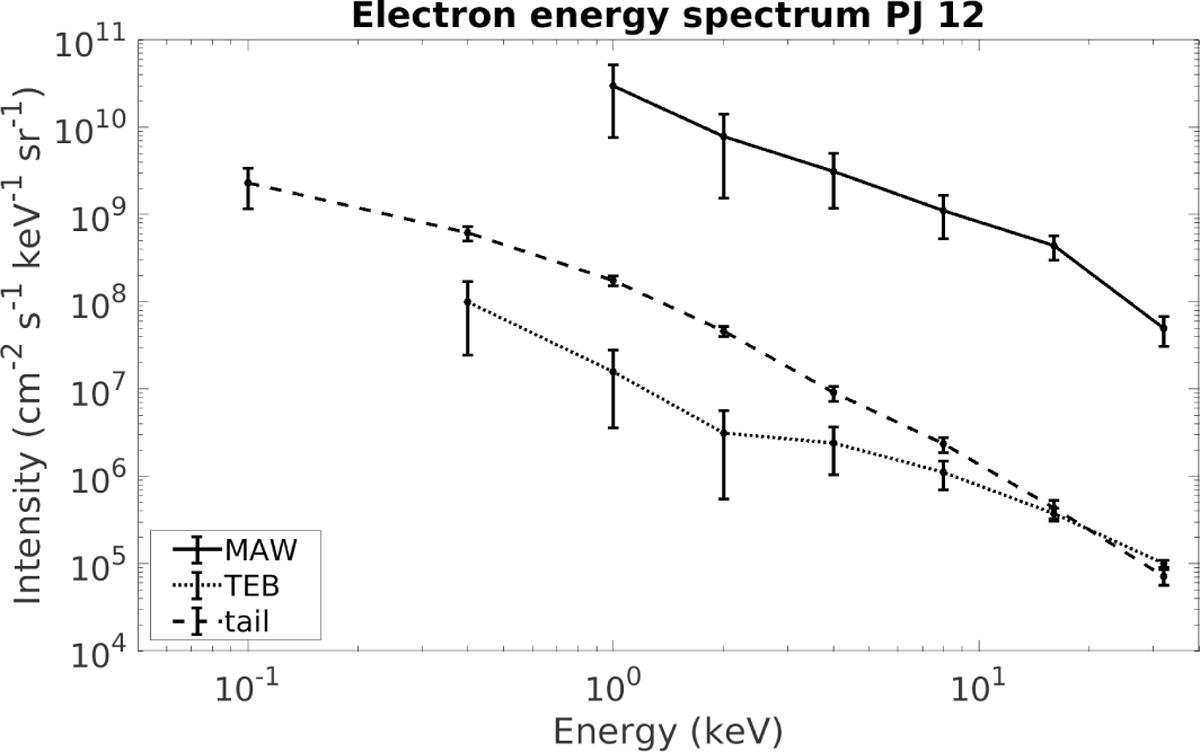
Energy spectra retrieved from UVS data acquired during PJ 12 (April 1, 2018). The black solid curve was obtained from the MAW spot profile using the UVS narrow slit, while the dotted and dashed lines come from the TEB spot and the tail, respectively.
Current usage metrics show cumulative count of Article Views (full-text article views including HTML views, PDF and ePub downloads, according to the available data) and Abstracts Views on Vision4Press platform.
Data correspond to usage on the plateform after 2015. The current usage metrics is available 48-96 hours after online publication and is updated daily on week days.
Initial download of the metrics may take a while.