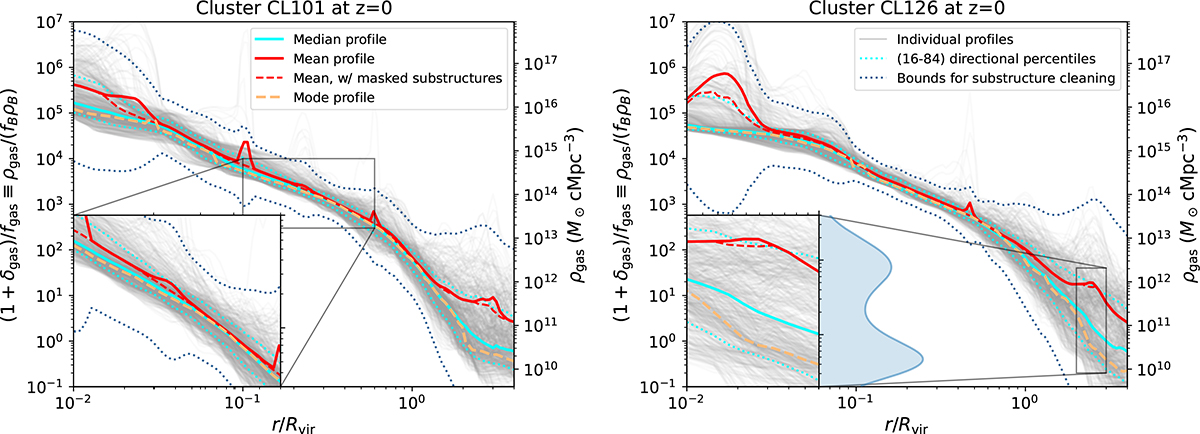
Fig. 1.
Download original image
Comparison between mean (solid red line), median (solid cyan line), and mode (dashed orange line) gas density profiles in two galaxy clusters (corresponding to the two panels). In addition to the standard mean profiles, mean profiles with masked substructures are shown by the dashed red lines. Light-grey lines indicate the individual directional profiles, while dotted cyan lines represent the (16−84)% percentiles at each r to give a better idea of the width of the density distribution. Dotted dark-blue lines indicate the thresholds for the substructure cleaning algorithm from which the dashed red line is obtained. The insets provide a zoomed-in view of two regions to highlight the differences among the profiles. The blue-filled line at the right of the right-hand panel inset depicts the density distribution at r ∼ 3Rvir, highlighting its bimodality.
Current usage metrics show cumulative count of Article Views (full-text article views including HTML views, PDF and ePub downloads, according to the available data) and Abstracts Views on Vision4Press platform.
Data correspond to usage on the plateform after 2015. The current usage metrics is available 48-96 hours after online publication and is updated daily on week days.
Initial download of the metrics may take a while.