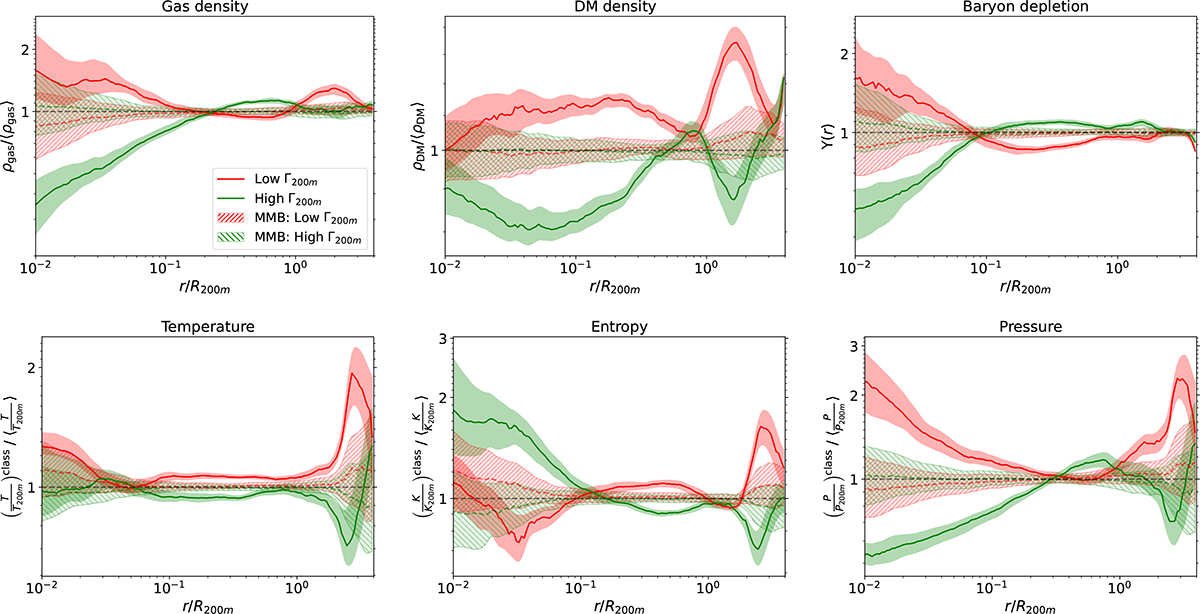
Fig. B.1.
Download original image
Mass-matched null bootstrap test. Each panel here corresponds to the second vertical panel of each column in Figs. 2 and 3. The control samples matched in M200m (hatched regions for the (16 − 84)% percentiles, dashed lines for the medians) show the expected distributions under the null hypothesis of no Γ200m dependence. The solid lines, along with the shaded regions, reproduce the original results (red: low-Γ200m; green: high-Γ200m). The separation of the solid lines beyond the hatched regions proves that the observed effects cannot be explained solely by the mass distribution of the low- and high-Γ200m subsamples.
Current usage metrics show cumulative count of Article Views (full-text article views including HTML views, PDF and ePub downloads, according to the available data) and Abstracts Views on Vision4Press platform.
Data correspond to usage on the plateform after 2015. The current usage metrics is available 48-96 hours after online publication and is updated daily on week days.
Initial download of the metrics may take a while.