Fig. 2.
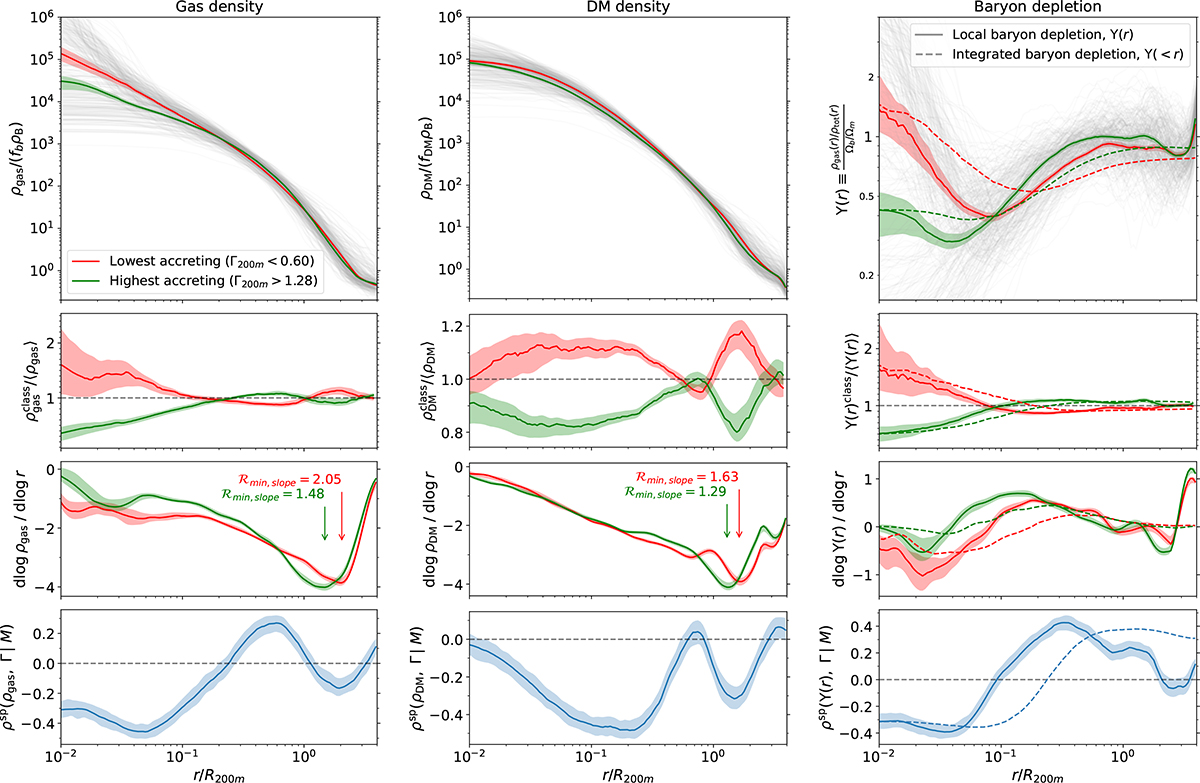
Download original image
Mass distribution for the highest accreting third (green) and lowest accreting third (red) of the sample. Left: Gas density. Center: DM density. Right: Baryon depletion. Top row: Profiles stacked over each subsample, together with the whole population (grey lines). Second row: Each class normalised by the ensemble average. Third row: Logarithmic slopes of the profiles, together with an indication of the radius of minimum slope. Bottom row: Correlation between the profiles and accretion rate Γ200m controlling for M200m.
Current usage metrics show cumulative count of Article Views (full-text article views including HTML views, PDF and ePub downloads, according to the available data) and Abstracts Views on Vision4Press platform.
Data correspond to usage on the plateform after 2015. The current usage metrics is available 48-96 hours after online publication and is updated daily on week days.
Initial download of the metrics may take a while.