Fig. 4.
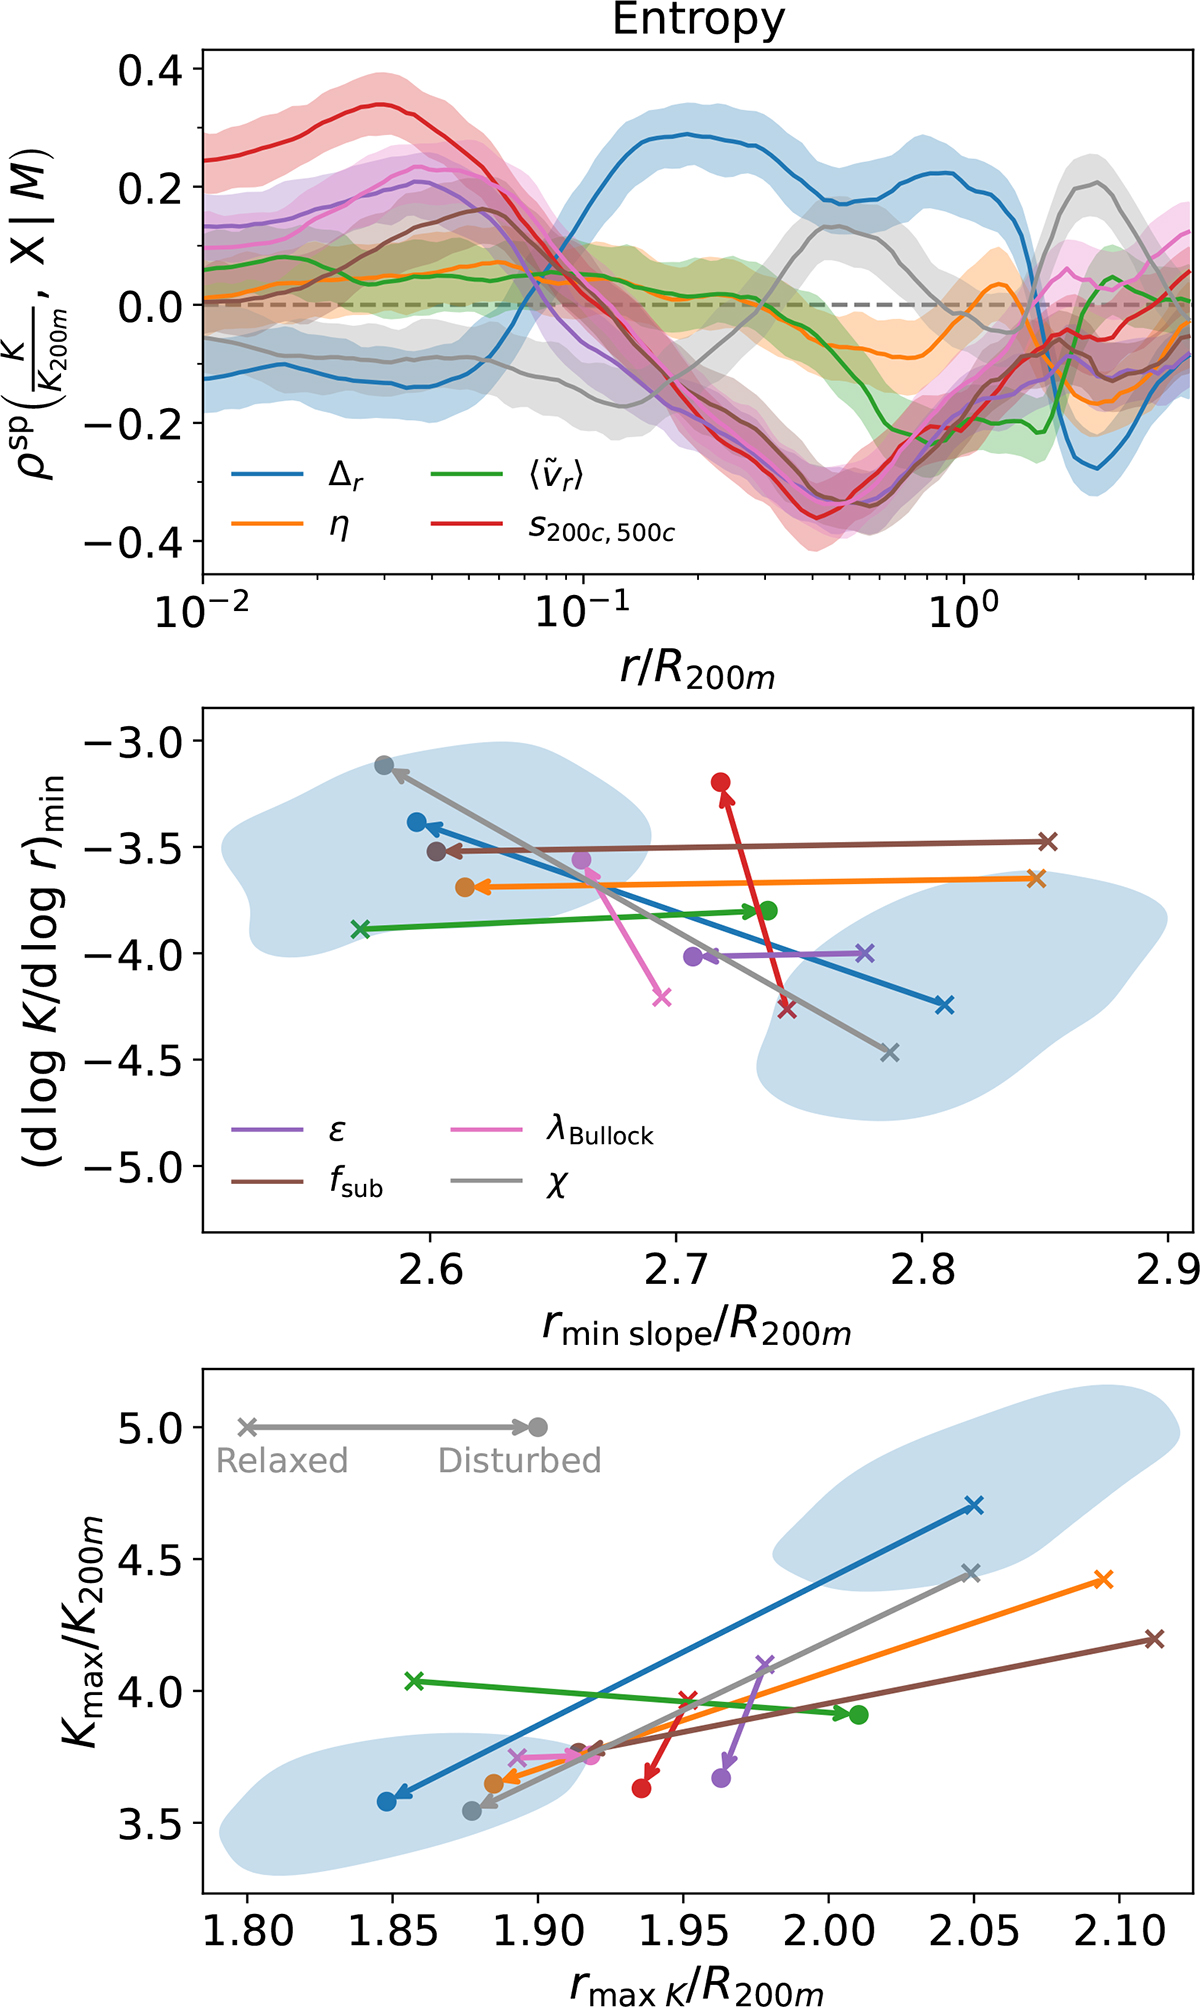
Download original image
Effect of individual indicators of assembly state on entropy profiles. Top: Spearman (partial) correlation coefficients of each indicator and profile values at each r/R200m. Higher magnitudes (either positive or negative) indicate a greater influence of the value of the indicator on the profile value at this particular radius. Middle: Effect of selecting clusters based on each parameter on the location and depth of the steepest logarithmic slope of the entropy profile. The crosses correspond to the profile stacked over the one-third most relaxed subsample (according to the given indicator), while the filled dots correspond to the most disturbed third. Bottom panel: Similar to the middle panel, but with the location and height of the entropy peak. The blue regions in the middle and bottom panels indicate the 68% confidence region for the determination of the corresponding locations over each of the Δr-based subsamples (as an example), obtained by bootstrap resampling.
Current usage metrics show cumulative count of Article Views (full-text article views including HTML views, PDF and ePub downloads, according to the available data) and Abstracts Views on Vision4Press platform.
Data correspond to usage on the plateform after 2015. The current usage metrics is available 48-96 hours after online publication and is updated daily on week days.
Initial download of the metrics may take a while.