Open Access
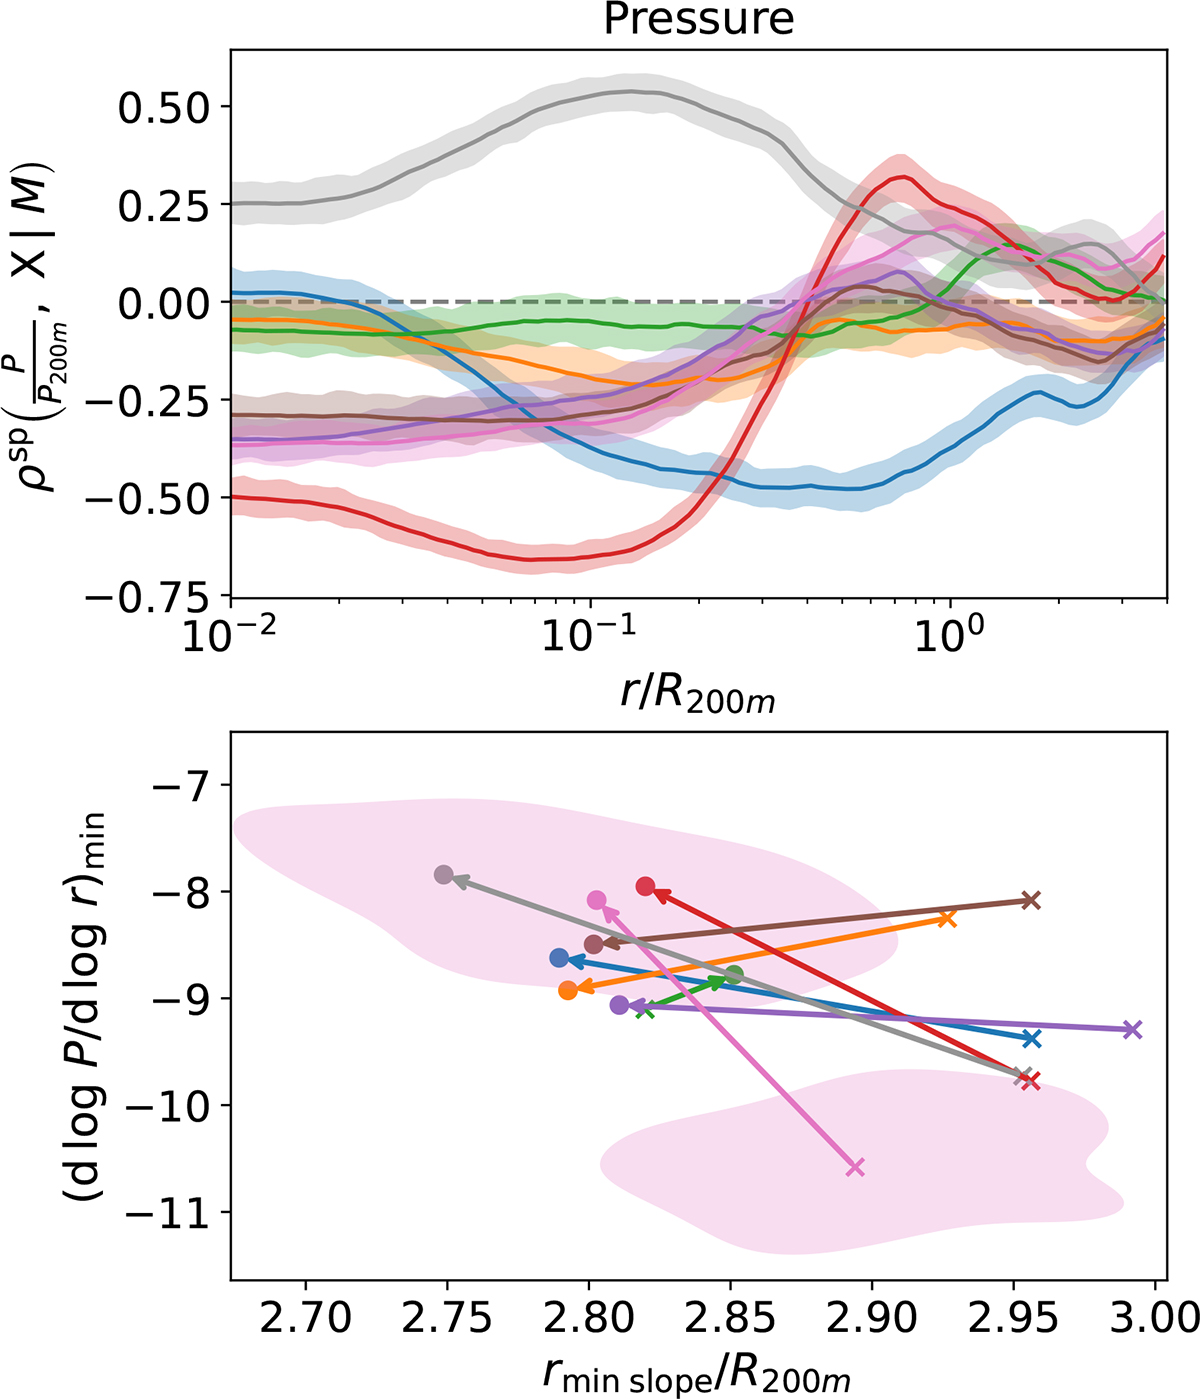
Fig. 5.
Download original image
Effect of individual indicators of assembly state on the pressure profiles. Top: Similar to that in Fig. 4, but with the pressure profiles. Bottom: Similar to the middle panel in Fig. 4, but with the pressure profiles. The colour code and other figure elements are kept the same as in the aforementioned figure.
Current usage metrics show cumulative count of Article Views (full-text article views including HTML views, PDF and ePub downloads, according to the available data) and Abstracts Views on Vision4Press platform.
Data correspond to usage on the plateform after 2015. The current usage metrics is available 48-96 hours after online publication and is updated daily on week days.
Initial download of the metrics may take a while.