Fig. 8.
Download original image
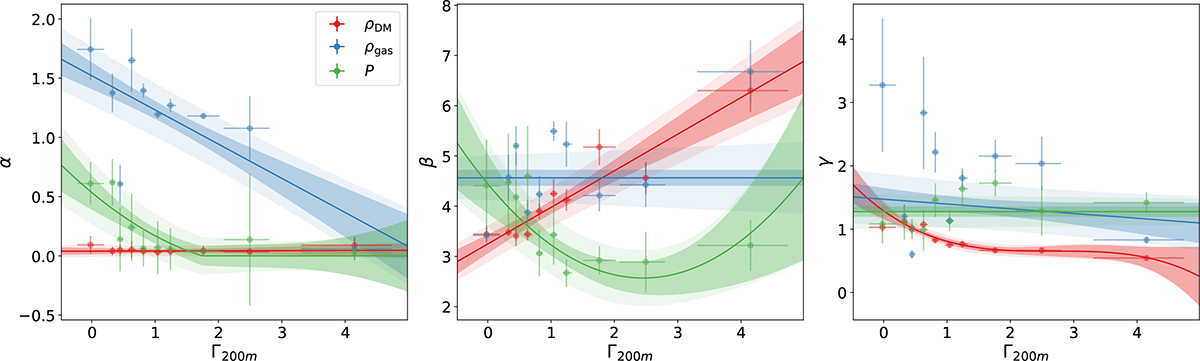
Dependence of the inner slope (α, left), the outer slope (β, middle), and the transition parameter (γ, right) of a gNFW model on the accretion rate, for the DM density (red), gas density (blue), and pressure (green) profiles. Dots with error bars represent the results from the fit to the profiles stacked over each decile in Γ200m. The lines represent least-squares polynomial fits, with the dark-shaded regions showing the fit uncertainty, and the light-shaded regions also including the uncertainty of the dots added in quadrature (assuming it depends linearly on Γ200m).
Current usage metrics show cumulative count of Article Views (full-text article views including HTML views, PDF and ePub downloads, according to the available data) and Abstracts Views on Vision4Press platform.
Data correspond to usage on the plateform after 2015. The current usage metrics is available 48-96 hours after online publication and is updated daily on week days.
Initial download of the metrics may take a while.