Open Access
Fig. 4
Download original image
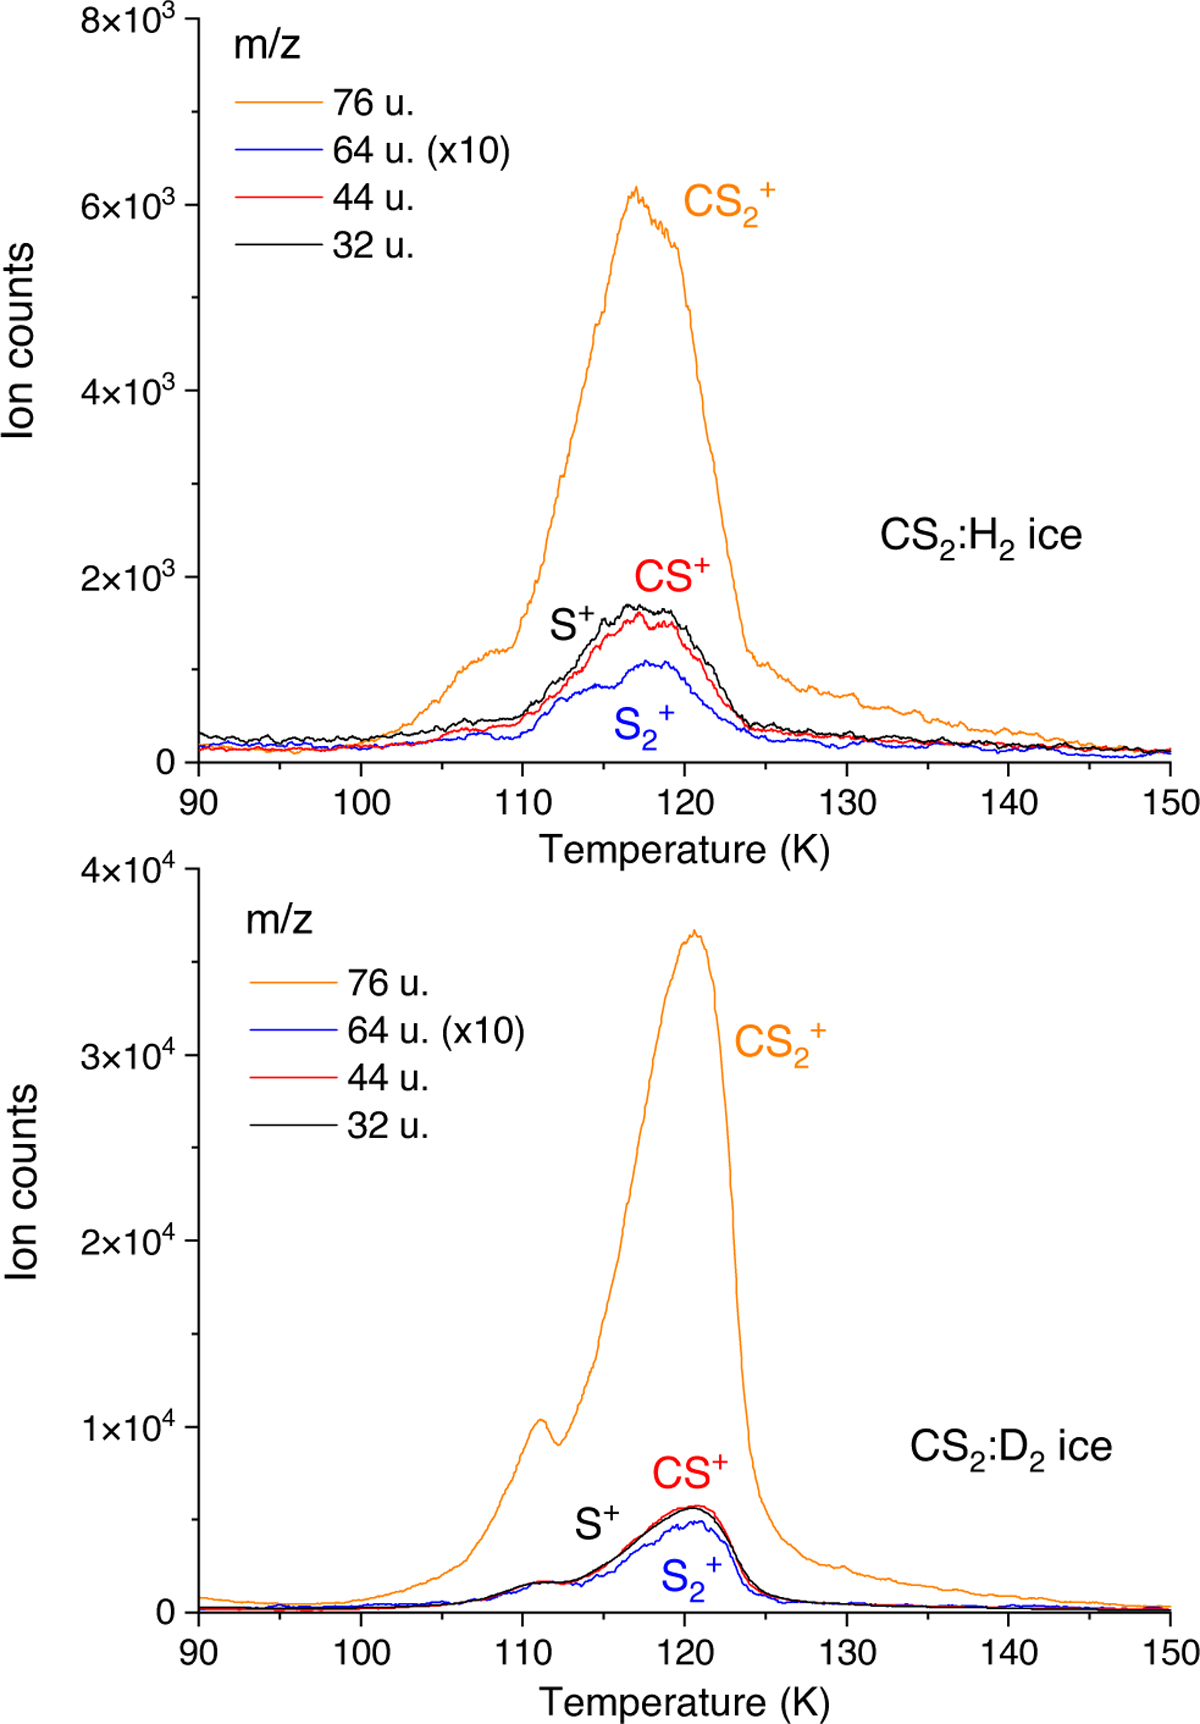
TPD signals of the m/z 76 u, 64 u, 44 u, and 32 u observed from VUV-irradiated CS2:H2 (top panel) and CS2:D2 (bottom panel) ices at 3.5 K. The signals on the m/z 64 u were multiplied by 10 for better clarity.
Current usage metrics show cumulative count of Article Views (full-text article views including HTML views, PDF and ePub downloads, according to the available data) and Abstracts Views on Vision4Press platform.
Data correspond to usage on the plateform after 2015. The current usage metrics is available 48-96 hours after online publication and is updated daily on week days.
Initial download of the metrics may take a while.