| Issue |
A&A
Volume 706, February 2026
|
|
|---|---|---|
| Article Number | A293 | |
| Number of page(s) | 8 | |
| Section | Interstellar and circumstellar matter | |
| DOI | https://doi.org/10.1051/0004-6361/202557502 | |
| Published online | 19 February 2026 | |
Vacuum ultraviolet photochemistry of CS2 isolated in H2/D2 matrices at 3.5 K
Sorbonne Université,
CNRS, MONARIS UMR 8233,
75005
Paris,
France
★ Corresponding author: This email address is being protected from spambots. You need JavaScript enabled to view it.
Received:
1
October
2025
Accepted:
20
January
2026
Abstract
Context. The evolution of sulphur-bearing species in the interstellar medium remains to be understood. One hypothesis that addresses the sulphur depletion issue postulates that sulphur-bearing molecules are present in interstellar ices, such as CS2. The evolution of CS2 under interstellar conditions has not yet been fully studied.
Aims. We performed experimental studies on the vacuum ultraviolet (VUV) photochemistry of CS2 with H2 under simulated interstellar conditions.
Methods. Gas mixtures of CS2 in either H2 or D2 with a relative proportion of 1:1000 were deposited on a gold substrate at 3.5 K. The matrices were irradiated with a VUV lamp, and the formed species were followed at 3.5 K by IR spectroscopy. Temperature programmed desorption (TPD) was also performed to probe desorbing species using quadrupolar mass spectrometry.
Results. The formation of CH4 (or CD4 with D2) and CS was detected by IR spectroscopy at 3.5 K. A slower formation kinetics of CD4 compared to CH4 is observed. No S-H bond formation was detected at 3.5 K, whereas the thermal desorption of H2S/D2S, CH3SH/CD3SD, and CH4/CD4 occurred during TPD. The desorption of S, S2, and S3 was not detected.
Conclusions. We conclude that the photo-dissociation channel CS2 → C + S2 C + S2 initiates the formation of CH4/CD4 via several reaction steps between the carbon atom and the H2/D2 matrix: C + 3H2/3D2 → CH4/CD4 + 2H/2D. We propose that the H/D generated by this reaction scheme induces the hydrogenation of the remaining sulphur-bearing species (S2, CS, S, and/or CS2) during TPD to form H2S/D2S and CH3SH/CD3SD. As no S-H bonds are detected at 3.5 K, the reactions H2 + X, where X = CS, S, and S2 in ground or excited states, do not seem to be effective. The astronomical relevance of these reaction channels is discussed.
Key words: astrochemistry / ISM: molecules
© The Authors 2026
 Open Access article, published by EDP Sciences, under the terms of the Creative Commons Attribution License (https://creativecommons.org/licenses/by/4.0), which permits unrestricted use, distribution, and reproduction in any medium, provided the original work is properly cited.
This article is published in open access under the Subscribe to Open model. This email address is being protected from spambots. You need JavaScript enabled to view it. to support open access publication.
1 Introduction
The depletion of sulphur in the interstellar medium (ISM) from diffuse to dense regions (Jenkins 2009) is still an open question, and it has received particular attention in the last decade. The main sulphur-bearing molecules observed in the gas phase of these dense regions are CS, OCS, H2S, SO, and SO2 (see e.g. Matthews et al. 1987; Minh et al. 1989; Charnley et al. 2001; Lique et al. 2006; Herpin et al. 2009; Cernicharo et al. 2011; Gratier et al. 2016; Goicoechea et al. 2021; Agúndez et al. 2025), and they do not account for the expected amount. These molecules have been intensively studied in the laboratory using interstellar ice analogues (see Mifsud et al. (2021) and references therein). The main hypothesis to resolve the sulphur depletion problem postulates that sulphur is locked up in interstellar ices or as refractory material in a form that is still undetected. Observations of interstellar ices suggest the presence of SO2 and OCS in such ices (Boogert et al. 2015), and future detections of sulphur-bearing molecules in interstellar ices with the James Webb Space Telescope will remain a challenge (Taillard et al. 2025).
The sulphur-bearing molecules expected in interstellar ices are, among others, sulphur allotropes (Mahjoub et al. 2024; Martín-Doménech et al. 2024b) and CS2, the latter of which has been detected in several irradiation experiments of interstellar ice analogues containing SO2 and H2S as sulphur precursors (Ferrante et al. 2008; Garozzo et al. 2010). CS2 has been detected in comets and has been proposed to be a parent molecule for CS and S, which have also been detected (Jackson et al. 1982; Calmonte et al. 2016). The formation of CS2 in interstellar clouds, as taken into account in astrochemical modelling, involves S2, S, CS, and/or HCS as parent molecules (Laas & Caselli 2019). Under cometary and interstellar conditions, vacuum ultraviolet (VUV) photochemistry is expected to have an influence on the evolution of the molecular species. The study of CS2 VUV photochemistry should therefore help us understand the evolution of sulphur species in cometary and ISM environments.
While hydrogenation reactions are one of the most important reactions taken into account in astrochemical modelling, reactions of the type H2 + X —→ XH + H (where X is a molecule or a radical) might also participate in the chemistry of the ISM. Even though activation barriers are generally expected for these reactions, they might be overcome by tunnelling at very low temperatures. These kinds of reactions have been experimentally proven to be effective, for example for the case where X = CD3 to form CD3H (Momose et al. 1998), X = OH to form H2O (Oba et al. 2012), and X = CN to form HCN (Borget et al. 2017). H2 is the most abundant species in the ISM. For instance, in dense clouds, its gaseous abundance is two to four orders of magnitude higher than that of atomic H (see the survey by Li & Goldsmith 2003). Although H2 is extremely volatile, previous experimental studies have shown that it can remain in water ice pores up to a temperature of 35 K (Sandford & Allamandola 1993; Dissly et al. 1994; Dulieu et al. 2005). Additionally, some authors suggest the presence of H2 molecular clusters in the ISM with possible embedded molecules between 3 and 15 K (Pfenniger & Puy 2003; Bernstein et al. 2013; Walker 2013). Consequently, solid H2 matrices formed under laboratory conditions can provide an experimental analogue of interstellar H2-containing ices. The study of photo-induced chemistry in such H2 matrices could highlight chemical pathways that have been neglected so far in astrochemistry.
In this study, we performed the VUV photolysis of CS2 isolated in a H2 matrix to generate sulphur-bearing species in order to study their reactivity with H2 at very low temperatures. The substitution of H2 with D2 also allowed us to examine the potential existence of tunnelling mechanisms for these reactions.
2 Experimental set-up
The experimental set-up consists of an ultra-high-vacuum chamber pumped by a turbomolecular pump (backed by an oil pump), which achieved a base pressure of 10−10 mbar at ambient temperature. At the centre of the chamber is a sample holder on which are mounted six circle gold mirrors of 1 cm2. The sample holder is mounted on the tip of the cold head of the second stage of a closed-cycle helium cryostat (Sumitomo cryogenics F-70). In the first stage, the cryostat cooled a radiation shield that contained 1 cm2 circle holes placed in front of the gold mirrors. The radiation shield and sample holder are rotatable, and the minimum temperature achievable on the gold mirrors (measured by a calibrated silicon diode) is 3.5 K. A heating resistor located near the gold mirrors and controlled by a programmable temperature controller (Lakeshore 336) allows for the temperature of the gold mirrors to be controlled in the 3.5-300 K range. Ices were grown by positioning a gold mirror in front a needled stainless-steel tube connected to a micro-leak valve; this allowed gas to be injected into the chamber with a controlled pressure. The micro-leak valve is connected to a gas line system that allowed for the mixing of gases prior to ice deposition. In this study, we deposited gaseous mixtures of CS2 (Sigma-Aldrich, anhydrous liquid, 99% purity) with either H2 (Alphagaz, gas bottle, ≥99.99% purity) or D2 (Alphaga, gas bottle, ≥99% purity) with a mixing ratio of ~ 1 : 1000 in terms of partial pressure measured in the gas line by a Pirani pressure gauge. The pressure inside the chamber during deposition was ~1 × 10⁻⁶ mbar, and the deposition time was ~30 minutes for each ice studied. The gold mirror temperature during deposition was 3.5 K.
The ices grown were probed by Fourier-transform infrared (FTIR) spectroscopy (Bruker vertex 80v) with a spectral resolution of 0.5 cm−1 in the 500-5000 cm−1 range and in transmission-reflection mode with an incidence angle of 8°. VUV irradiation of the ices was performed at 3.5 K by positioning the gold mirror a few centimetres in front of a Hamamatsu L10706 UV lamp. The emission spectrum of the lamp ranges from 121 nm (10.2 eV) to 160 nm (7.75 eV) and is dominated by the 160 nm emission (75%). The total photon flux on the gold mirror is estimated to be 1015 photons cm−2 s−1. VUV irradiations of a few tens of seconds were sufficient to detect photo-products in the ice via FTIR spectroscopy. IR spectra of the irradiated ices were recorded at several irradiation steps. After VUV irradiation, temperature programmed desorption (TPD) was performed: the ices were warmed from 3.5 K to 40 K with a heating ramp of 2 K min−1 and from 40 K to 300 K with a heating ramp of 0.3 K min−1, the latter being the maximum heating ramp achievable above 40 K given the design of our cryostat. Species thermally desorbing from the ice during TPD were probed in the gas phase by a quadrupolar mass spectrometer (QMS - Hidden Analytical) as a function of the gold mirror temperature.
3 Results
3.1 Infrared spectroscopy
Figure 1 shows the IR spectra of CS2 isolated in a H2 or D2 matrix (with a dilution factor of ~1:1000) at 3.5 K before and after VUV irradiation. The main IR feature observed is the ν3 asymmetric stretching mode of 12C32S2 at 1531 cm−1 and that of its isotope 12C34S32S at 1527 cm−1 (see e.g. Tsuge & Lee 2017), which are displayed in the inset on the bottom right of Fig. 1. The IR band observed at 2345 cm−1 is due to the presence of CO2 pollution. New IR features appear with the ongoing VUV irradiation. In the H2 matrix (bottom panels of Fig. 1), the most intense ones are at 3025 cm−1, 1308 cm−1, and 1276 cm−1. In the D2 matrix (top panels of Fig. 1), the 1276 cm−1 peak is also observed, whereas the others are not. Instead, two peaks at 2260 cm−1 and at 990 cm−1 appear with the ongoing VUV irradiation. We associated the 1276 cm−1 peak (and also the 1273 cm−1 peak observed in the D2 matrix) with the stretching mode of CS, based on previous work on rare gas matrices (Bohn et al. 1992; Bahou et al. 2000). The 3025 cm−1 and 1308 cm−1 peaks in the case of the H2 matrix point towards the vibrational modes of CH4 (the ν3 and ν4, respectively), which are shifted to 2260 cm−1 and 990 cm−1 when a D2 matrix is used, hence when CD4 is produced, as observed in previous work on rare gas matrices (Chamberland et al. 1970; Chapados & Cabana 1972; Govender & Ford 2000) and N2 matrices (Wu et al. 2012). Minor bands, denoted by an asterisk in Fig. 1, are also observed at 1252 cm−1 and 1218 cm−1 in the D2 matrix and at 1231 cm−1 in the H2 matrix. A possible attribution of these bands, based on the work of Tsuge & Lee (2017), is the formation of t-DSCS and t-HSCS. However, the other expected IR bands of these species - especially the S-H and S-D stretching, which are expected near 2530 and 1827 cm−1, respectively - are not detected, which makes the formation of t-DSCS and t-HSCS very speculative in our experiments, and we therefore do not take them into account in our analysis.
In Fig. 2, we study the kinetic of the photolysis of CS2 and its identified photo-products. We plot the evolution of the column densities (N) of CS2 (ν3 mode), CH4/CD4 (ν3 and ν4 modes), and CS with the ongoing irradiation and relative to the initial column density (N0) of CS2. The column densities were computed by dividing the band areas by the IR band strength taken from the literature:
For the ν3 mode of CS2, we took the gas phase value of 9.30 × 10⁻¹⁷ cm molecule−1 from Person & Hall (1964), which is close to the value of 1.06 × 10⁻¹⁶ cm molecule−1 estimated in Taillard et al. (2025) for a pure amorphous CS2 ice at 8 K. A relative uncertainty of ~4% is given in Person & Hall (1964).
For CH4, we took the value from Hudgins et al. (1993) for the ice mixture N2:CH4 (20:1), with measurements at 10 and 20 K. This mixture is the most relevant since in our experiments, CH4 is surrounded by a diatomic homonuclear molecule with no permanent dipole (H2). The weak van der Waals interactions between CH4 and H2 are therefore best replicated when considering CH4 isolated in a N2 matrix. We corrected the band strengths of Hudgins et al. (1993) by considering a methane density of 0.45 g cm−3, as suggested in Bouilloud et al. (2015). This results in a band strength of 3.11 × 10⁻¹⁷ cm molecule−1 for the ν3 mode of CH4 and 2.22 × 10⁻¹⁷ cm molecule−1 for the ν4 mode, with a 30% uncertainty as given in Hudgins et al. (1993). IR band strengths of CD4 ices are not available in the literature to our knowledge and may vary from that of CH4 . However, since no data are available, we took the same values as for CH4.
For CS, we used the work of Botschwina & Sebald (1985), who computed, via ab initio calculations, an integrated molar IR intensity for isolated CS of Γ = 6254 cm2 mol−1 that has a dimension of a molar cross-section and can be converted to an absorption line strength (SP) using the equation SP = νΓ × 4.087 × 10⁻⁵, expressed in atm−1 cm−2 (Botschwina 1983) and where ν = 1276 cm−1. Then, SP can be converted into the band strength (SN) expressed in cm molecule−1 using SN = kBTSP, where kB is the Boltzmann constant and T = 298 K (see Šimečková et al. 2006). This results in an IR band strength for the CS stretching mode of 1.32 × 10⁻¹⁷ cm molecule−1, with an uncertainty of 10% as given in Botschwina & Sebald (1985).
Note that the previous band strengths were in some cases measured in transmittance IR spectroscopy and would need to be modified by a correction factor since our IR spectra were obtained in reflection-absorption mode (see e.g. Martín-Doménech et al. 2024a). However, since in Fig. 2 only ratios of band strengths are presented, such a factor is cancelled out.
A few tens of seconds of VUV irradiation were sufficient to observe the photo-products in the IR spectrum. While the destruction of CS2 and the formation of CS both exhibit an exponential behaviour, that of CH4 (or CD4) is linear in our irradiation time range, as shown by the linear fit in the bottom panels of Fig. 2 (dashed lines). At the end of the VUV irradiation experiments, at which point the photon fluence for the H2 matrix was 2.10 × 10¹⁷ photon cm−2 and that for the D2 matrix was 1.65 × 10¹⁷ photon cm−2, ~24% ± 2% and ~45% ± 5% of CS2 was converted into CS in the H2 and D2 matrices respectively. For CH4/CD4, if we assume that their IR band strengths are similar, the formation of CH4 is between −2 and −3 times faster than that of CD4 . In order to obtain the effective destruction and formation cross-section for CS2 and CS, we fitted the data points of the top panels of Fig. 2 using the following equations:
For CS2:
 , where y0, A, and b are fitted. Then we derived the effective destruction crosssection of CS2 from b using b = φ × σ(CS2), where φ is the photon flux per cm2 and is equal to 1015 photons cm−2 s−1 and σ(CS2) is the effective destruction cross-section of CS2. We derived σ(CS2) = 1.07 ± 0.10 × 10⁻¹⁷ cm2 and σ(CS2) = 8.98 ± 0.58 × 10⁻¹⁸ cm2 for the H2 and D2 matrix, respectively.
For CS:
 where a and b are fitted. Then we derived the effective formation cross-section of CS, σ(CS), from b as we did for CS2. We obtained σ(CS) = 3.65 ± 0.24 × 10⁻¹⁷ cm2 and σ(CS) = 3.32 ± 0.17 × 10⁻¹⁷ cm2 for the H2 and D2 matrix, respectively.
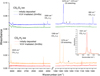 |
Fig. 1 IR spectra of CS2 isolated in either a H2 matrix (bottom panels) or a D2 matrix (top panels) grown at 3.5 K. Spectra before VUV irradiation (as deposited) and after VUV irradiation are compared. The identified vibrational modes and associated species are discussed in the text. The spectra are vertically shifted for better clarity. The bottom-right inset shows the main IR feature observed, which corresponds to the asymmetric stretching mode of CS2. |
3.2 Temperature programmed desorption
After VUV irradiation of the ices, we performed TPD from 3.5 K to 300 K. Between 3.5 K and 40 K, desorption of H2/D2 occurred and a desorption signal on the mass channel m/z 32 u was detected between 20 K and 40 K. This signal was not associated with sulphur (S) desorption but rather with O2 pollution since (i) a blank TPD experiment with non-irradiated CS2:H2 ice showed a similar signal and (ii) the desorption temperature observed is typical of O2 desorption as found in the literature (Collings et al. 2004). Above 40 K, several QMS signals were detected during TPD. The heating ramp used in the displayed temperature range is 0.3 K min−1. Figure 3 shows the mass channels for which a signal was observed. In the left panels, we observe the desorption on the m/z 14 u, 15 u, 16 u, 18 u, and 20 u. In the H2 matrix, the relative intensities of the m/z 16 u, 15 u, and 14 u match the electron impact fragmentation pattern of CH4 of the NIST database (Linstrom & Mallard 2022). In the D2 matrix, negligible signals are observed in the previous mass channels, whereas signals in the mass channels m/z 20 u, 18 u, and 16 u appear and point towards the desorption of CD4. The desorption temperatures observed in these mass channels are also consistent with the desorption of CH4 compared to what is found in the literature (Collings et al. 2004; Tamai et al. 2023). We also note that the desorption temperature of CD4 is approximately 2 K above that of CH4 . The detection of CH4/CD4 desorption is also consistent with the fact that we observe its characteristic vibrational signatures in the IR spectra presented in Sect. 3.1.
In the middle panels of Fig. 3, we observe the desorption on the m/z 32 u, 33 u, 34 u, and 36 u. The relative intensities of the TPD signals and the shift in m/z when going from H2 to D2 point towards the thermal desorption of H2S/D2S. The peak desorption temperature of H2S/D2S that we observe, which is 53 K for H2S and 56 K for D2S, is however below that observed in previous studies, i.e. in the 70-90 K range depending on the heating ramp used (Collings et al. 2004; Jiménez-Escobar & Muñoz Caro 2011; Santos et al. 2023, 2025). This difference may be due to our very low heating ramp (0.3 K min−1) compared to that used in the previous studies (4.8 K min−1 for Collings et al. 2004; 1 Kmin−1 for Jiménez-Escobar & Muñoz Caro 2011; 5 K min−1 for Santos et al. 2023; and 2 K min−1 for Santos et al. 2025). Previous work shows that lowering heating ramps in TPD experiments results in a shift of the desorption peak to lower temperatures (Brown & Bolina 2006; Kruczkiewicz, F. et al. 2024). In the right panel of Fig. 3, the detection of the m/z 47 u, 48 u, 50 u, and 52 u suggests the desorption of CH3SH/CD3SD when looking at the fragmentation pattern (Linstrom & Mallard 2022) and the shift in m/z when using D2 instead of H2. Similarly to H2S/D2S, the peak desorption temperature that we observe for CH3SH/CD3SD, which is 65 K for CH3SH and 69 K for CD3SD, is lower than what is found in the literature, although fewer studies exist (Liu et al. 2002; Narayanan et al. 2025). In Narayanan et al. (2025), a peak desorption temperature slightly above 100 K is found for multi-layer CH3SH and sub-monolayer CH3SH on top of water ice. Liu et al. (2002) studied a sub-monolayer CH3SH layer adsorbed on gold, which resembles our experimental conditions. The peak desorption temperature in Liu et al. (2002) ranges from 130 K to 200 K depending on the coverage. However, a heating ramp of 3 K min−1 was used, which is ten times higher than our heating ramp of 0.3 K min−1.
Temperature programmed desorption signals on the m/z 44 u were detected in the 50-70 K and 100-130 K temperature ranges. The signal in the lowest temperature range was associated with the desorption of CO2 pollution since (i) a blank TPD experiment with non-irradiated CS2 :H2 ice showed a similar signal and (ii) the desorption temperature observed is typical of CO2 desorption as found in the literature (Collings et al. 2004). In the highest temperature range, the m/z 44 u signal was associated with CS2 fragmentation into CS+, as shown in Fig. 4, since the TPD shapes of the m/z 44 u and m/z 76 u (CS+2) match and the relative intensities are consistent with the fragmentation pattern of CS2 given by the NIST database (Linstrom & Mallard 2022). Therefore, no desorption signals on the m/z 44 u could be associated with CS desorption. This will be further discussed.
The thermal desorption of S, S2, and S3 was searched for in the corresponding mass channels (m/z 32 u, 64 u, and 96 u, respectively). Signals on the m/z 32 u were detected in the 20-40 K range (associated with O2 desorption, as discussed previously), the 50-65 K range (associated with H2S/D2S fragmentation into S+, as shown in Fig. 3 and as discussed previously), and the 100-130 K range. As shown in Fig. 4, and for similar reasons as for the m/z 44 u attribution in this temperature range, the m/z 32 u signal in the 100-130 K range was associated with CS2 fragmentation into S+. Desorption signals on the m/z 64 u were detected only in the 100-130 K range but were associated with the fragmentation of CS2 into S+2 since (i) our CS2 sample showed a fragmentation signal on the m/z 64 u with a minor contribution of ~1.3% with respect to the m/z 76 u when gaseous CS2 was introduced in our ultra-high-vacuum chamber, which is consistent with the relative intensities shown in Fig. 4, and (ii) the TPD shapes of the m/z 64 u and m/z 76 u match, as shown in Fig. 4. Note that Martín-Doménech et al. (2024b) did find a S2 TPD signal in this temperature range from irradiated CO:CS2 ice. Finally, no signal was detected on the m/z 96 u at any temperature during TPD. Therefore, we did not detect any desorption of S, S2, or S3 in our experiments. Additionally, we did not detect any TPD signals on the m/z 66 u and m/z 68 u that could be associated with H2S2 and D2S2 formation, respectively.
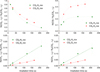 |
Fig. 2 Evolution of the column densities (N) of CS2 (v3; top-left panel), CS (top-right panel), and CH4 (ν3 in the bottom-left panel and ν4 in the bottom-right panel) as a function of irradiation time and relative to the initial column density (N0) of the ν3 mode of CS2. |
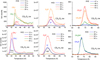 |
Fig. 3 TPD signals observed during the warming of the VUV irradiated ices obtained from CS2:D2 ice (top) and CS2:H2 ice (bottom). Identified species are also displayed. |
4 Discussion and astrophysical implications
The emission spectrum of our VUV lamp spans the 121-160 nm (7.75-10.2 eV) range. In this energy range, H2/D2 cannot be photo-dissociated since the lower energy threshold for H2 photodissociation is 11.15 eV (Sharp 1970; Glover & Brand 2001). We can also neglect the direct excitation of H2/D2 (into an electronically excited state or into a high vibrational state of the ground electronic state) since dipole transitions in this energy range are forbidden. The photodissociation of CS2 in this energy range includes the following channels (see Li et al. 2021 and references therein):
 (1)
(1)
 (2)
(2)
In Eq. (1), CS and S can be on different electronic levels (singulet X1Σ+ and triplet a3Π states for CS and 3S, 1D, 1S, and 3P states for S). The thermochemical threshold for channel (2) has been estimated to be lower than 7.45 eV (for C in the 3P0 state and S2 in the X3∑−g state); the dissociation mechanism is discussed in Li et al. (2021).
The formation of methane CH4/CD4 in our experiments is most likely induced by the formation of C(3P) via photodissociation channel (2). Methane formation in interstellar conditions has been the subject of intense research. While the successive hydrogenation of carbon atoms in four steps has been taken into account in astrochemical models and confirmed experimentally (Hiraoka et al. 1998; Qasim et al. 2020), this formation path cannot occur in our experiments since hydrogen is present only in molecular form. Previous experimental and theoretical work has however shown the formation of CH4 via carbon atoms and H2 only, on top of water ice at 10 K (Lamberts et al. 2022). The reaction scheme proposed in this study is the following:
 (3)
(3)
 (4)
(4)
 (5)
(5)
Under the experimental conditions of Lamberts et al. (2022), H atoms generated from (4) and (5) are assumed to desorb immediately from the ice at 10 K and to not participate in the formation of CH4. Reaction (3) has been found to occur experimentally without barrier in helium droplets (Krasnokutski et al. 2016; Henning & Krasnokutski 2019), and barriers of 49 kJ mol−1 and 44 kJ mol−1 are found for reactions (4) and (5), respectively (Bauschlicher 1978; Li et al. 2015; Beyer et al. 2016). A similar reaction scheme is expected in our experiments for both CH4 and CD4 formation. Under the assumption that the IR band strengths of CH4 and CD4 do not significantly differ, a slower formation kinetic is observed for CD4, as shown in the bottom panels of Fig. 2. This might be due to a higher reaction barrier for (4) and/or (5) when D2 is used and/or due to the involvement of a tunnelling mechanism for these reactions, as suggested in Lamberts et al. (2022). The fact that the final amount of CS formed in the D2 matrix is ~2 times higher than in H2 is difficult to explain a priori. Assuming that CD4 formation is less efficient than CH4 formation, the recombination reaction C + S2 —→ CS + S (exothermic) might be favoured in the D2 matrix, which would explain the higher amount of CS.
Another puzzling observation originates from the mass balance derived from IR spectroscopy (see Fig. 2) at 3.5 K and at the end of the VUV irradiation. In the D2 matrix, ~ 57% of the initial amount of CS2 is destroyed; this is roughly consistent with the amount of CD4 plus CS formed, which accounts for [49%; 56%] of the initial CS2 amount when considering the uncertainties on the IR band strengths. In the H2 matrix, however, ~ 70% of the initial CS2 is destroyed, and the amount of CH4 plus CS observed is in the [32%; 48%] range of the initial CS2 amount. Therefore, between 22% and 38% of the initial CS2 is missing in the irradiated CS2:H2 ice. We propose that, due to the high exothermicity of the C + 3H2 → CH4 + 2H scheme (~18 eV based on standard enthalpies), the chemical desorption of some of the CH4 formed might explain the missing initial CS2 in the mass balance derived from IR spectroscopy. As this reaction is most probably less efficient in the case of the D2 matrix (due to higher barriers), the mass balance in the D2 matrix would not be impacted by possible CD4 chemical desorption.
While the formation and thermal desorption of H2S/D2S and CH3SH/CD3SD was detected by TPD during the warming of the ice, their formation during VUV irradiation at 3.5 K does not seem to occur. Note that IR spectra were recorded above 8 K (after the H2/D2 matrix desorption) but did not show any vibrational signature of H2S/D2S or CH3SH/CD3SD, while these molecules were detected in TPD. This can be easily explained by the fact that FTIR spectroscopy is less sensitive than quadrupole mass spectrometry by order(s) of magnitude. The non-formation of these molecules during the VUV irradiation at 3.5 K is confirmed by the non-detection of any S-H bond formation, which would have produced IR signatures in the 2650-2550 cm−1 range and would have corresponded to the SH stretching mode(s) of, for instance, H2 S (Isoniemi et al. 1999; Soulard & Tremblay 2019) or CH3SH (Hudson 2016). Given that the IR band strengths of CH4 (from 4.7 × 10⁻¹⁸ cm molecule−1 to 1.7 × 10⁻¹⁷ for the ν4 mode depending on the ice mixture considered; Boogert et al. 1997), H2S (~1.7 × 10⁻¹⁷ cm molecule−1 for the S-H stretch in pure ice or mixed with H2O ice at 10 K; Yarnall & Hudson 2022), and CH3SH (~5.5 × 10⁻¹⁸ cm molecule−1 for the S-H stretch in pure ice at 17 K; Hudson 2016) are of the same order of magnitude, H2S and CH3SH should indeed be detected in our IR spectra if these molecules were formed at 3.5 K in similar amounts as CH4. This means that while carbon atoms induce chemistry in the H2/D2 matrix after the photo-dissociation of CS2, the other expected fragments, which are CS (detected in our IR spectra), S, and S2, do not seem to react further at 3.5 K. This strongly suggests that the diffusion of species when the ice is being warmed is needed to induce further chemistry to form H2S/D2S and CH3 SH/CD3 SD.
Since (i) no chemical reaction seem to occur at 3.5 K between H2/D2 and CS, S, or S2 and (ii) the H2/D2 matrix thermally desorbs around 5 K, we can safely assume that the H2/D2 does not initiate the formation of H2S/D2S and CH3SH/CD3SD during the warming of the ice. Instead, we propose that the H/D atoms generated from reactions (4) and (5) are trapped in the H2/D2 matrix at 3.5 K and then start to diffuse and react with either CS2 or its fragments when the ice warms up. The non-detection of CS during TPD suggests that it may be hydrogenated during the warming up to form, for instance, CH3SH. The hydrogenation of CS to CH3SH, however, has low energy barriers (<5 kJ mol−1) for the first and third hydrogenation steps (Lamberts 2018). Since the sulphur fragments S and S2 are also not detected during TPD, they may be hydrogenated as well to form, for instance, H2S. They may also aggregate to form allotropes (Sn) with n > 3. The assumption that CS and S hydrogenation plays a role during TPD might be consistent with the amounts of CS2, H2S/D2S, and CH3SH/CD3SH observed in the TPD curves of Figs. 3 and 4. Indeed, while CS2 is detected in the D2 case at roughly six times the abundance found in the H2 case during TPD, D2S and CD3SD are less abundant than H2S and CH3SH. These differences might be explained by (i) a higher amount of CS and S available at the end of the VUV irradiation for the D2 case, as shown by the top-right panel of Fig. 2, and (ii) plausible higher barriers of D addition to CS and S compared to H addition. Accordingly, the CS + S recombination to reform CS2 during TPD would be favoured over the CS and S deuteration in the D2 case, while the opposite occurs in the H2 case. This would explain the higher amounts of CS2 reformation during TPD in the D2 case and the lower amounts of D2S and CD3SD formation compared to H2S and CH3SH, respectively.
From our results, we determined the following astrophysical implications of the chemistry of sulphur-bearing species in the ISM:
Our experiments show that the reactions H2 + X, where X corresponds to S, S2, or CS (and S is in the 3P, 1D, or 1S state; S2 is in the X1∑−g, a1∆g, or b1∑+g state; and CS is in the X1Σ+ or a3Π state; Li et al. 2021), do not seem to occur under interstellar conditions at the very low temperature of 3.5 K.
The reaction scheme forming methane from carbon atoms and molecular hydrogen, which has already been the subject of several studies, is confirmed in our experiments in which CS2 under VUV irradiation is a precursor for the generation of carbon atoms in the 3P state. Additionally, this shows that while astrochemical models generally consider the photodissociation of CS2 into CS + S to be the main dissociation pathway (see e.g. Laas & Caselli 2019), the dissociation into C + S2 has to be taken into account, as suggested in Li et al. (2021).
The successive hydrogenation of CS seems to be responsible for our detection of CH3 SH, which indicates that the CS + H hydrogenation network is effective in the very low temperatures of interstellar clouds despite the presence of low activation energies (<5 kJ mol−1) in the first and third hydrogenation steps (Lamberts 2018).
The non-detection of S, S2, and S3 in our experiments suggests that these molecules (i) are not formed in a sufficient amount to be detected in our experiments, (ii) aggregate to form large allotropes, or (iii) are hydrogenated during the warming of our ices. While the non-detection of these small allotropes is different from other experimental studies on sulphur in interstellar ice analogues (Martín-Doménech et al. 2024b; Mahjoub et al. 2024), our results might corroborate the conclusions in Carrascosa et al. (2024). The competition between the hydrogenation of small sulphur allotropes and their aggregation under interstellar conditions remains to be studied.
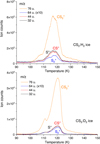 |
Fig. 4 TPD signals of the m/z 76 u, 64 u, 44 u, and 32 u observed from VUV-irradiated CS2:H2 (top panel) and CS2:D2 (bottom panel) ices at 3.5 K. The signals on the m/z 64 u were multiplied by 10 for better clarity. |
5 Conclusion
The VUV photochemistry of CS2 isolated in either a H2 or D2 matrix at 3.5 K was studied. The formation of CH4/CD4 and CS was observed at 3.5 K via IR spectroscopy, and no IR signatures of S-H bonds in the 2650-2550 cm−1 range were detected. The formation kinetics of CD4 is found to be slower than that of CH4 . The warming of the matrices induced the thermal desorption of CH4/CD4 as well as H2S/D2S and CH3 SH/CD3 SD, which are not detected in the IR spectra at 3.5 K. The dissociation channel CS2 → C + S2, which is currently not taken into account in astrochemical modelling, is assumed to be responsible for the formation of CH4/CD4 via C + 3H2/3D2 → CH4/CD4 + 2H/2D. The H/D generated is assumed to diffuse and hydrogenate the sulphur-bearing species CS, S, S2, and/or CS2 during the warming of the ice, which would explain the detection of H2S/D2S and CH3SH/CD3SD during TPD. The dissociation channel CS2 —→ CS + S does not lead to further reactivity with H2/D2 at 3.5 K. The small allotropes S, S2, and S3 are not detected during TPD, which suggests either the hydrogenation of S and S2 or their aggregation to form larger allotropes during TPD. Several conclusions for the sulphur chemistry under interstellar conditions are discussed.
References
- Agúndez, M., Molpeceres, G., Cabezas, C., et al. 2025, A&A, 693, L20 [NASA ADS] [CrossRef] [EDP Sciences] [Google Scholar]
- Bahou, M., Lee, Y.-C., & Lee, Y.-P. 2000, JACS, 122, 661 [Google Scholar]
- Bauschlicher, C. W. 1978, Chem. Phys. Lett., 56, 31 [Google Scholar]
- Bernstein, L. S., Clark, F. O., & Lynch, D. K. 2013, ApJ, 768, 84 [Google Scholar]
- Beyer, A. N., Richardson, J. O., Knowles, P. J., Rommel, J., & Althorpe, S. C. 2016, JPC Lett., 7, 4374 [Google Scholar]
- Bohn, R. B., Hannachi, Y., & Andrews, L. 1992, JACS, 114, 6452 [Google Scholar]
- Boogert, A., Schutte, W., Helmich, F., Tielens, A., & Wooden, D. 1997, A&A, 317, 929 [NASA ADS] [Google Scholar]
- Boogert, A. A., Gerakines, P. A., & Whittet, D. C. 2015, Ann. Rev. A&A, 53, 541 [Google Scholar]
- Borget, F., Müller, S., Grote, D., et al. 2017, A&A, 598, A22 [NASA ADS] [CrossRef] [EDP Sciences] [Google Scholar]
- Botschwina, P. 1983, Chem. Phys., 81, 73 [Google Scholar]
- Botschwina, P., & Sebald, P. 1985, J. Mol. Spectrosc., 110, 1 [Google Scholar]
- Bouilloud, M., Fray, N., Bénilan, Y., et al. 2015, MNRAS, 451, 2145 [Google Scholar]
- Brown, W. A., & Bolina, A. S. 2006, MNRAS, 374, 1006 [Google Scholar]
- Calmonte, U., Altwegg, K., Balsiger, H., et al. 2016, MNRAS, 462, S253 [NASA ADS] [CrossRef] [Google Scholar]
- Carrascosa, H., Muñoz Caro, G. M., Martín-Doménech, R., et al. 2024, MNRAS, 533, 967 [Google Scholar]
- Cernicharo, J., Spielfiedel, A., Balança, C., et al. 2011, A&A, 531, A103 [NASA ADS] [CrossRef] [EDP Sciences] [Google Scholar]
- Chamberland, A., Belzile, R., & Cabana, A. 1970, Can. J. Chem., 48, 1129 [Google Scholar]
- Chapados, C., & Cabana, A. 1972, Can. J. Chem., 50, 3521 [Google Scholar]
- Charnley, S., Ehrenfreund, P., & Kuan, Y.-J. 2001, Spectrochim. Acta A: Mol. Biomol. Spectrosc., 57, 685 [NASA ADS] [CrossRef] [Google Scholar]
- Collings, M. P., Anderson, M. A., Chen, R., et al. 2004, MNRAS, 354, 1133 [NASA ADS] [CrossRef] [Google Scholar]
- Dissly, R. W., Allen, M., & Anicich, V. G. 1994, ApJ, 435, 685 [Google Scholar]
- Dulieu, F., Amiaud, L., Baouche, S., et al. 2005, Chem. Phys. Lett., 404, 187 [Google Scholar]
- Ferrante, R. F., Moore, M. H., Spiliotis, M. M., & Hudson, R. L. 2008, ApJ, 684, 1210 [NASA ADS] [CrossRef] [Google Scholar]
- Garozzo, M., Fulvio, D., Kanuchova, Z., Palumbo, M. E., & Strazzulla, G. 2010, A&A, 509, A67 [NASA ADS] [CrossRef] [EDP Sciences] [Google Scholar]
- Glover, S. C. O., & Brand, P. W. J. L. 2001, MNRAS, 321, 385 [Google Scholar]
- Goicoechea, J. R., Aguado, A., Cuadrado, S., et al. 2021, A&A, 647, A10 [EDP Sciences] [Google Scholar]
- Govender, M., & Ford, T. 2000, J. Mol. Struct., 550, 445 [Google Scholar]
- Gratier, P., Majumdar, L., Ohishi, M., et al. 2016, ApJ Suppl. Ser., 225, 25 [Google Scholar]
- Henning, T. K., & Krasnokutski, S. A. 2019, Nat. Astron., 3, 568 [Google Scholar]
- Herpin, F., Marseille, M., Wakelam, V., Bontemps, S., & Lis, D. C. 2009, A&A, 504, 853 [NASA ADS] [CrossRef] [EDP Sciences] [Google Scholar]
- Hiraoka, K., Miyagoshi, T., Takayama, T., Yamamoto, K., & Kihara, Y. 1998, ApJ, 498, 710 [CrossRef] [Google Scholar]
- Hudgins, D. M., Sandford, S. A., Allamandola, L. J., & Tielens, A. G. G. M. 1993, ApJs, 86, 713 [Google Scholar]
- Hudson, R. L. 2016, PCCP, 18, 25756 [Google Scholar]
- Isoniemi, E., Pettersson, M., Khriachtchev, L., Lundell, J., & Räsänen, M. 1999, JPC A, 103, 679 [Google Scholar]
- Jackson, W. M., Halpern, J. B., Feldman, P. D., & Rahe, J. 1982, A&A, 107, 385 [NASA ADS] [Google Scholar]
- Jenkins, E. B. 2009, ApJ, 700, 1299 [Google Scholar]
- Jiménez-Escobar, A., & Muñoz Caro, G. M. 2011, A&A, 536, A91 [Google Scholar]
- Krasnokutski, S. A., Kuhn, M., Renzler, M., et al. 2016, ApJ, 818, L31 [CrossRef] [Google Scholar]
- Kruczkiewicz, F., Dulieu, F., Ivlev, A. V., et al. 2024, A&A, 686, A236 [NASA ADS] [CrossRef] [EDP Sciences] [Google Scholar]
- Laas, J. C., & Caselli, P. 2019, A&A, 624, A108 [NASA ADS] [CrossRef] [EDP Sciences] [Google Scholar]
- Lamberts, T. 2018, A&A, 615, L2 [NASA ADS] [CrossRef] [EDP Sciences] [Google Scholar]
- Lamberts, T., Fedoseev, G., van Hemert, M. C., et al. 2022, ApJ, 928, 48 [NASA ADS] [CrossRef] [Google Scholar]
- Li, D., & Goldsmith, P. F. 2003, Apj, 585, 823 [Google Scholar]
- Li, J., Chen, J., Zhao, Z., et al. 2015, JCP, 142, 204302 [Google Scholar]
- Li, Z., Zhao, M., Xie, T., et al. 2021, JPC Lett., 12, 844 [Google Scholar]
- Linstrom, P., & Mallard, W. 2022, NIST Standard Reference Database Number 69, 20899 [Google Scholar]
- Lique, F., Cernicharo, J., & Cox, P. 2006, ApJ, 653, 1342 [NASA ADS] [CrossRef] [Google Scholar]
- Liu, G., Rodriguez, J. A., Dvorak, J., Hrbek, J., & Jirsak, T. 2002, Surf. Sci., 505, 295 [Google Scholar]
- Mahjoub, A., Hodyss, R., Altwegg, K., Fayolle, E., & Choukroun, M. 2024, PSJ, 5, 234 [Google Scholar]
- Martín-Doménech, R., DelFranco, A., Öberg, K. I., & Rajappan, M. 2024a, ApJ, 962, 107 [Google Scholar]
- Martín-Doménech, R., Öberg, K. I., Muñoz Caro, G. M., et al. 2024b, MNRAS, 535, 807 [CrossRef] [Google Scholar]
- Matthews, H. E., MacLeod, J. M., Broten, N. W., Madden, S. C., & Friberg, P. 1987, ApJ, 315, 646 [NASA ADS] [CrossRef] [Google Scholar]
- Mifsud, D. V., Kaňuchová, Z., Herczku, P., et al. 2021, Space Sci. Rev., 217, 14 [CrossRef] [Google Scholar]
- Minh, Y. C., Irvine, W. M., & Ziurys, L. M. 1989, ApJ, 345, L63 [NASA ADS] [CrossRef] [Google Scholar]
- Momose, T., Hoshina, H., Sogoshi, N., et al. 1998, JCP, 108, 7334 [Google Scholar]
- Narayanan, S., Piacentino, E. L., Öberg, K. I., & Rajappan, M. 2025, ApJ, 986, 10 [Google Scholar]
- Oba, Y., Watanabe, N., Hama, T., et al. 2012, Apj, 749, 67 [Google Scholar]
- Person, W. B., & Hall, L. C. 1964, Spectrochim. Acta, 20, 771 [NASA ADS] [CrossRef] [Google Scholar]
- Pfenniger, D., & Puy, D. 2003, A&A, 398, 447 [NASA ADS] [CrossRef] [EDP Sciences] [Google Scholar]
- Qasim, D., Fedoseev, G., Chuang, K.-J., et al. 2020, Nat. Astron., 4, 781 [NASA ADS] [CrossRef] [Google Scholar]
- Sandford, S. A., & Allamandola, L. J. 1993, ApJ, 409, L65 [NASA ADS] [CrossRef] [Google Scholar]
- Santos, J. C., Linnartz, H., & Chuang, K.-J. 2023, A&A, 678, A112 [NASA ADS] [CrossRef] [EDP Sciences] [Google Scholar]
- Santos, J. C., Piacentino, E. L., Bergner, J. B., Rajappan, M., & Öberg, K. I. 2025, A&A, 698, A254 [NASA ADS] [CrossRef] [EDP Sciences] [Google Scholar]
- Sharp, T. 1970, Atomic Data Nucl. Data Tables, 2, 119 [Google Scholar]
- Simecková, M., Jacquemart, D., Rothman, L. S., Gamache, R. R., & Goldman, A. 2006, JQSRT, 98, 130 [Google Scholar]
- Soulard, P., & Tremblay, B. 2019, JCP, 151, 124308 [Google Scholar]
- Taillard, A., Martín-Doménech, R., Carrascosa, H., et al. 2025, A&A, 694, A263 [NASA ADS] [CrossRef] [EDP Sciences] [Google Scholar]
- Tamai, C., Maté, B., Cazaux, S., & Satorre, M. 2023, A&A, 675, A47 [Google Scholar]
- Tsuge, M., & Lee, Y.-P. 2017, PCCP, 19, 9641 [Google Scholar]
- Walker, M. A. 2013, MNRAS, 434, 2814 [Google Scholar]
- Wu, Y.-J., Wu, C. Y. R., Chou, S.-L., et al. 2012, ApJ, 746, 175 [NASA ADS] [CrossRef] [Google Scholar]
- Yarnall, Y. Y., & Hudson, R. L. 2022, ApJ, 931, L4 [CrossRef] [Google Scholar]
All Figures
|
Fig. 1 IR spectra of CS2 isolated in either a H2 matrix (bottom panels) or a D2 matrix (top panels) grown at 3.5 K. Spectra before VUV irradiation (as deposited) and after VUV irradiation are compared. The identified vibrational modes and associated species are discussed in the text. The spectra are vertically shifted for better clarity. The bottom-right inset shows the main IR feature observed, which corresponds to the asymmetric stretching mode of CS2. |
| In the text | |
|
Fig. 2 Evolution of the column densities (N) of CS2 (v3; top-left panel), CS (top-right panel), and CH4 (ν3 in the bottom-left panel and ν4 in the bottom-right panel) as a function of irradiation time and relative to the initial column density (N0) of the ν3 mode of CS2. |
| In the text | |
|
Fig. 3 TPD signals observed during the warming of the VUV irradiated ices obtained from CS2:D2 ice (top) and CS2:H2 ice (bottom). Identified species are also displayed. |
| In the text | |
|
Fig. 4 TPD signals of the m/z 76 u, 64 u, 44 u, and 32 u observed from VUV-irradiated CS2:H2 (top panel) and CS2:D2 (bottom panel) ices at 3.5 K. The signals on the m/z 64 u were multiplied by 10 for better clarity. |
| In the text | |
Current usage metrics show cumulative count of Article Views (full-text article views including HTML views, PDF and ePub downloads, according to the available data) and Abstracts Views on Vision4Press platform.
Data correspond to usage on the plateform after 2015. The current usage metrics is available 48-96 hours after online publication and is updated daily on week days.
Initial download of the metrics may take a while.