Fig. 1.
Download original image
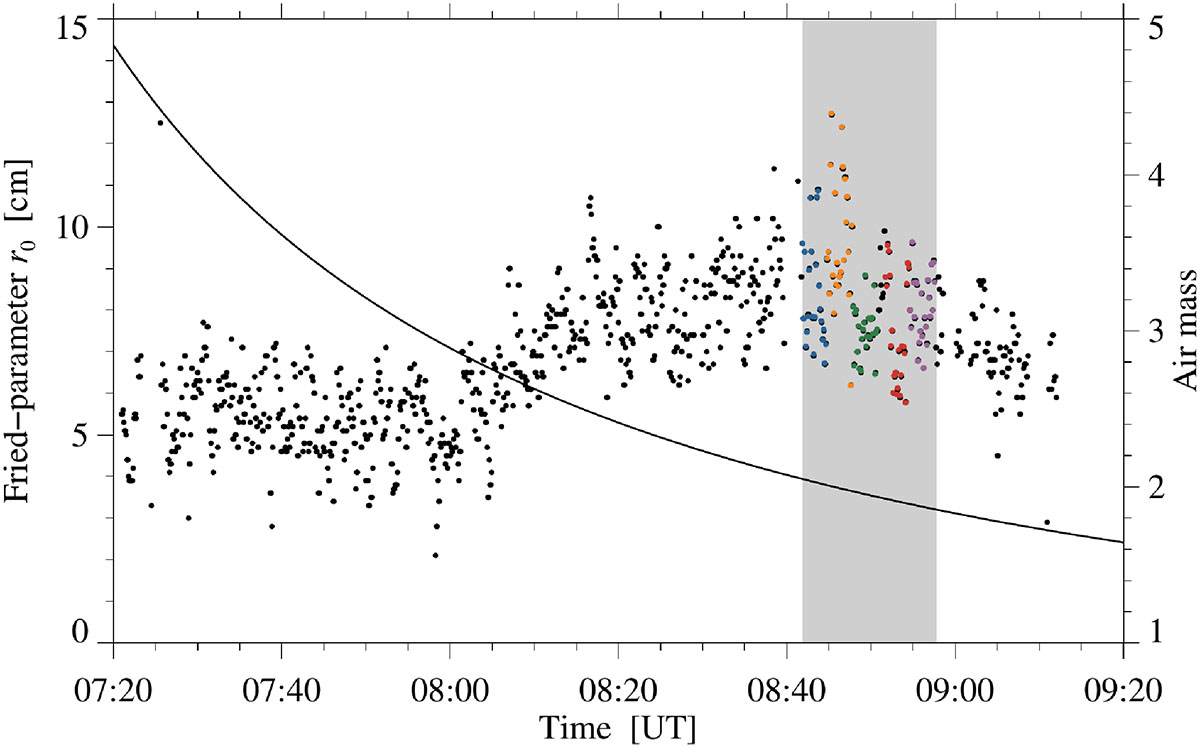
Temporal evolution of the Fried-parameter r0 (black dots) and air mass (solid line) during the 16 July 2023 observations with the 1.5-metre Gregor solar telescope. The light grey rectangle corresponds to the time interval of the HiFI+ observations. The black dots were taken from the Gregor status monitor and the colour-coded dots are recorded in the headers of the GRIS scans. The colour-coded dots refer to the Fried-parameter r0 for each step during the five GRIS scans. The air mass was obtained by using the web interface to the JPL Horizons On−Line Ephemeris System.
Current usage metrics show cumulative count of Article Views (full-text article views including HTML views, PDF and ePub downloads, according to the available data) and Abstracts Views on Vision4Press platform.
Data correspond to usage on the plateform after 2015. The current usage metrics is available 48-96 hours after online publication and is updated daily on week days.
Initial download of the metrics may take a while.