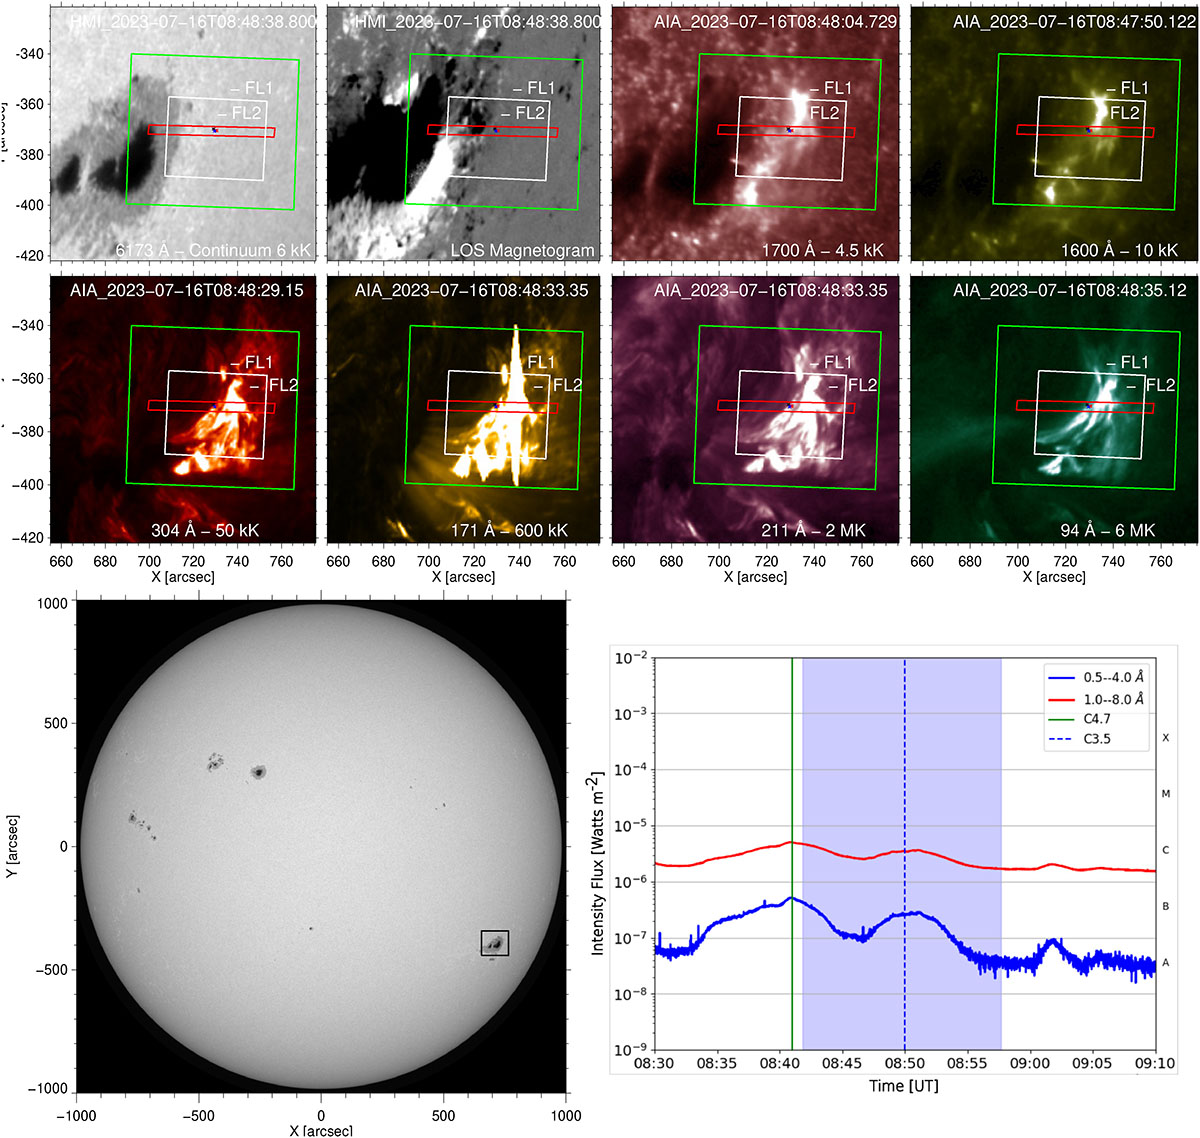
Fig. 2.
Download original image
Collection of SDO observations taken at around 08:48 UT. Co-aligned Gregor/GRIS slit-scan and HiFI+ FOVs are shown as red and green (TiO) as well as white (Ca II H) rectangles, respectively. The locations of the first flare (FL1) and second flare (FL2) are labelled in each panel. The bottom left image displays an HMI continuum image of the solar disc at the time of the observation, highlighting with a black square the location of the active region of interest. The lower right panel shows the temporal evolution of the X-ray flux recorded by GOES in the 1.0–8.0 Å (red) and 0.5–4.0 Å (blue) channels for the period from 08:30 UT – 09:10 UT on 16 July 2023. Gregor’s observations are indicated by the shaded blue region. The X-ray maxima are indicated by a solid green line for FL1 and a dotted blue line for FL2, corresponding to the flare peaks. The temporal evolution of the flares is shown in Movie 1 (available online).
Current usage metrics show cumulative count of Article Views (full-text article views including HTML views, PDF and ePub downloads, according to the available data) and Abstracts Views on Vision4Press platform.
Data correspond to usage on the plateform after 2015. The current usage metrics is available 48-96 hours after online publication and is updated daily on week days.
Initial download of the metrics may take a while.