Open Access
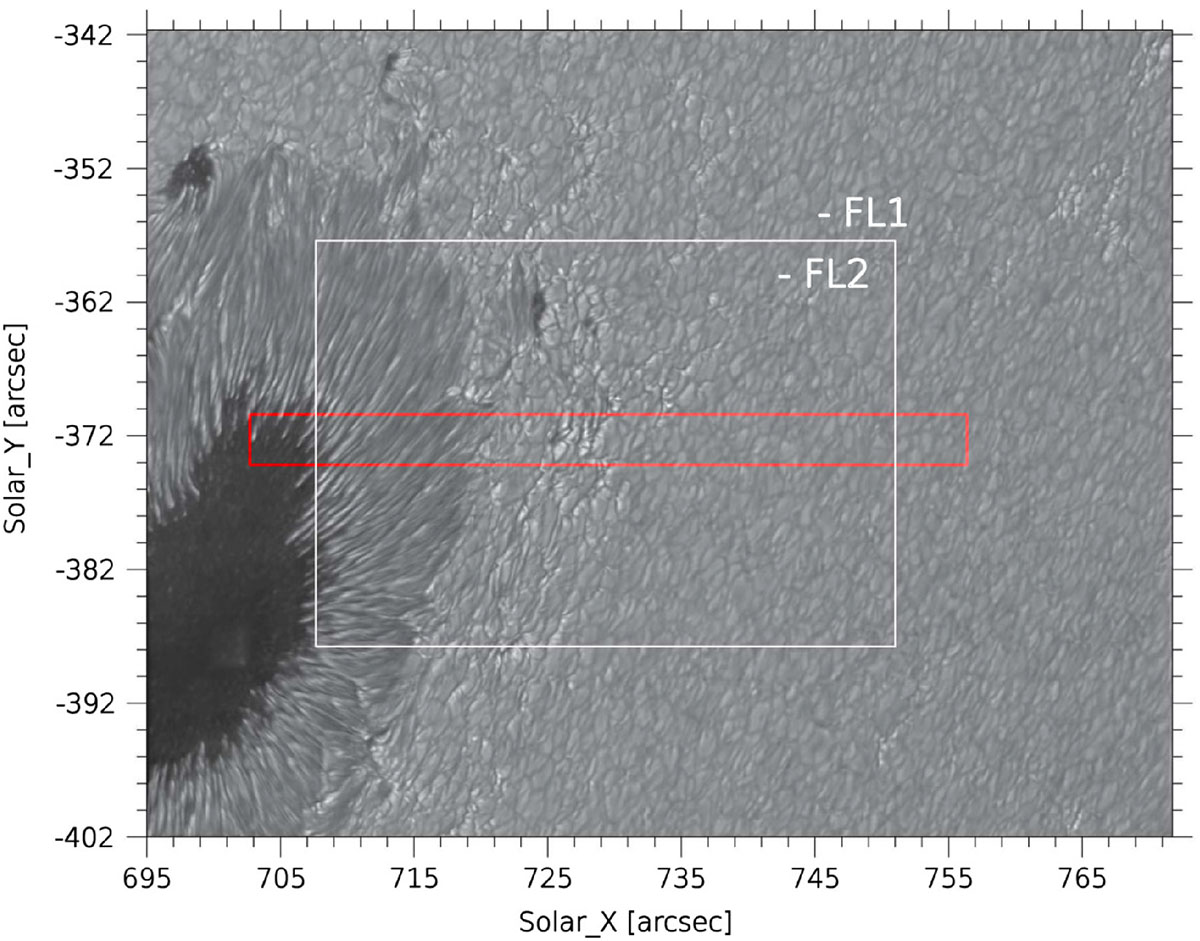
Fig. 3.
Download original image
Speckle-restored TiO image taken at 08:45:18 UT at the start of the second flare FL2. The white rectangle indicates the size and location of the speckle-restored Ca II H image shown in Fig. 4. The solid red rectangle shows the area covered by the Gregor/GRIS slit-scan. The associated animation is provided as Movie 2.
Current usage metrics show cumulative count of Article Views (full-text article views including HTML views, PDF and ePub downloads, according to the available data) and Abstracts Views on Vision4Press platform.
Data correspond to usage on the plateform after 2015. The current usage metrics is available 48-96 hours after online publication and is updated daily on week days.
Initial download of the metrics may take a while.