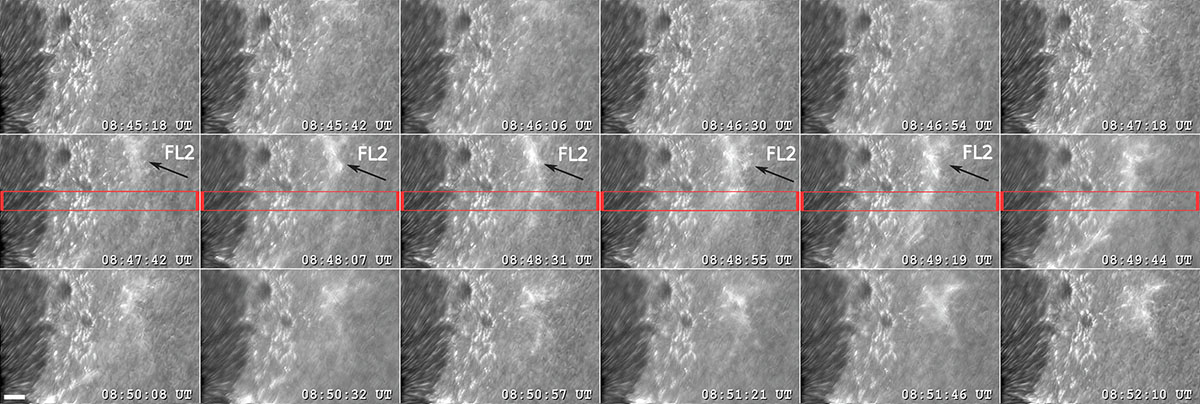
Fig. 4.
Download original image
Time series of speckle-restored Ca II H images showing the temporal evolution of the second flare FL2 at a cadence of about 12 s (time interval − 24 s). The small white rectangle in the lower left corner has a size of 5″ × 1″. Gregor/GRIS slit scans are indicated by the solid red rectangle. The black arrow and the label ‘FL2’ indicate the identified location of the second flare. Note that the FOV of these HiFI+ Ca II H observations does not cover the location of FL1, which lies outside these panels. The corresponding time evolution is available in Movie 3.
Current usage metrics show cumulative count of Article Views (full-text article views including HTML views, PDF and ePub downloads, according to the available data) and Abstracts Views on Vision4Press platform.
Data correspond to usage on the plateform after 2015. The current usage metrics is available 48-96 hours after online publication and is updated daily on week days.
Initial download of the metrics may take a while.