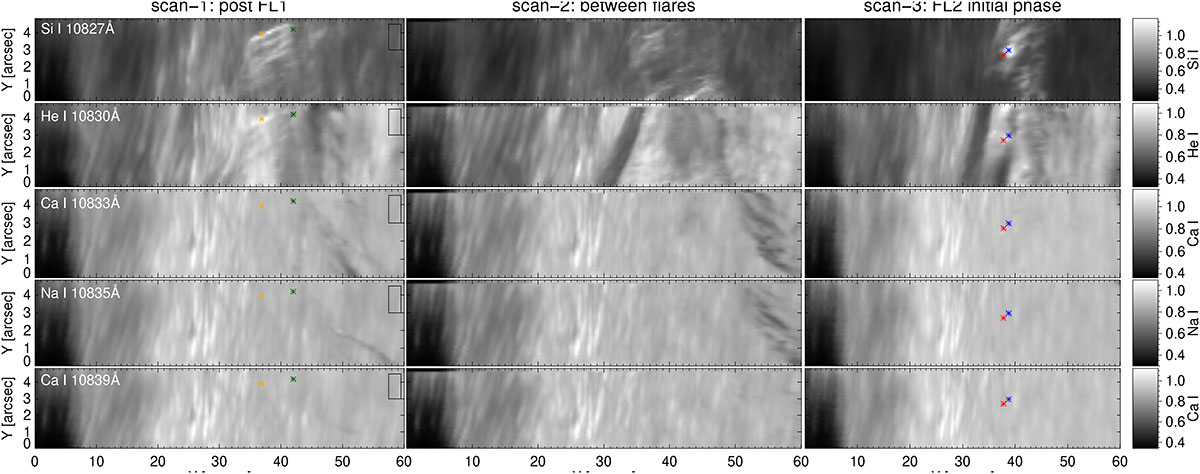
Fig. 6.
Download original image
Spatial distribution of the intensity at the line core rest wavelength of five selected spectral lines observed with the GRIS instrument during three consecutive scans of the target region. From left to right, columns correspond to Scan 1 (08:41:53–08:44:48 UT), Scan 2 (08:45:44–08:47:43 UT), and Scan 3 (08:47:49–08:50:48 UT), respectively. From top to bottom, we show the spatial distribution of the line core rest wavelength of Si I 10827 Å, the He I 10830 Å triplet, Ca I 10833 Å, Na I 10835 Å, and the Ca I 10839 Å line. Coloured asterisks mark the location of the reference profiles that we study in detail later. The spatial region used for intensity normalisation is marked by a black box in the bottom panels.
Current usage metrics show cumulative count of Article Views (full-text article views including HTML views, PDF and ePub downloads, according to the available data) and Abstracts Views on Vision4Press platform.
Data correspond to usage on the plateform after 2015. The current usage metrics is available 48-96 hours after online publication and is updated daily on week days.
Initial download of the metrics may take a while.