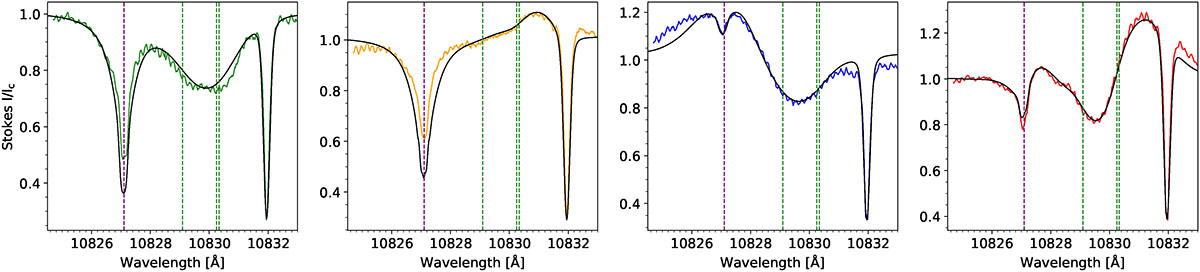
Fig. 8.
Download original image
Comparison between the GRIS observed intensity profiles and those synthesised with the HAZEL code. Each panel corresponds to a reference profile that shows a distinct spectral shape, and whose location on the Sun is highlighted in Fig. 6. We used the same colour code as that figure for the observations, while synthetic profiles are plotted in black. The spectral range only contains the Si I 10827.1 Å, the He I 10830 Å triplet, and the telluric line at 10832 Å for visualisation purposes. In contrast, vertical dashed lines designate the rest wavelength of the mentioned spectral lines.
Current usage metrics show cumulative count of Article Views (full-text article views including HTML views, PDF and ePub downloads, according to the available data) and Abstracts Views on Vision4Press platform.
Data correspond to usage on the plateform after 2015. The current usage metrics is available 48-96 hours after online publication and is updated daily on week days.
Initial download of the metrics may take a while.