Open Access
Fig. 1.
Download original image
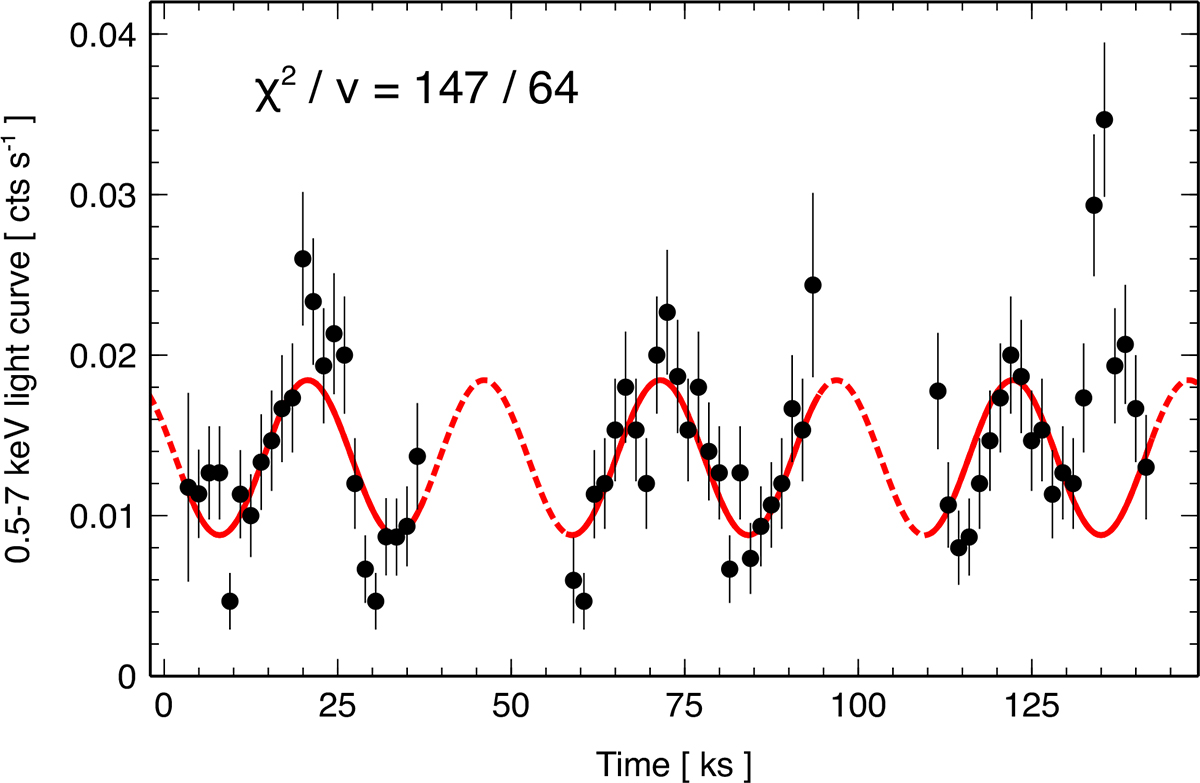
Chandra light curve (black points) in the 0.5–7 keV band of ObsIDs 22648, 22649, and 23182. The bin time is 1500 s. The best-fit sinusoidal is shown in red. The dotted line shows the model’s extrapolation during time intervals with no data.
Current usage metrics show cumulative count of Article Views (full-text article views including HTML views, PDF and ePub downloads, according to the available data) and Abstracts Views on Vision4Press platform.
Data correspond to usage on the plateform after 2015. The current usage metrics is available 48-96 hours after online publication and is updated daily on week days.
Initial download of the metrics may take a while.