Fig. 4.
Download original image
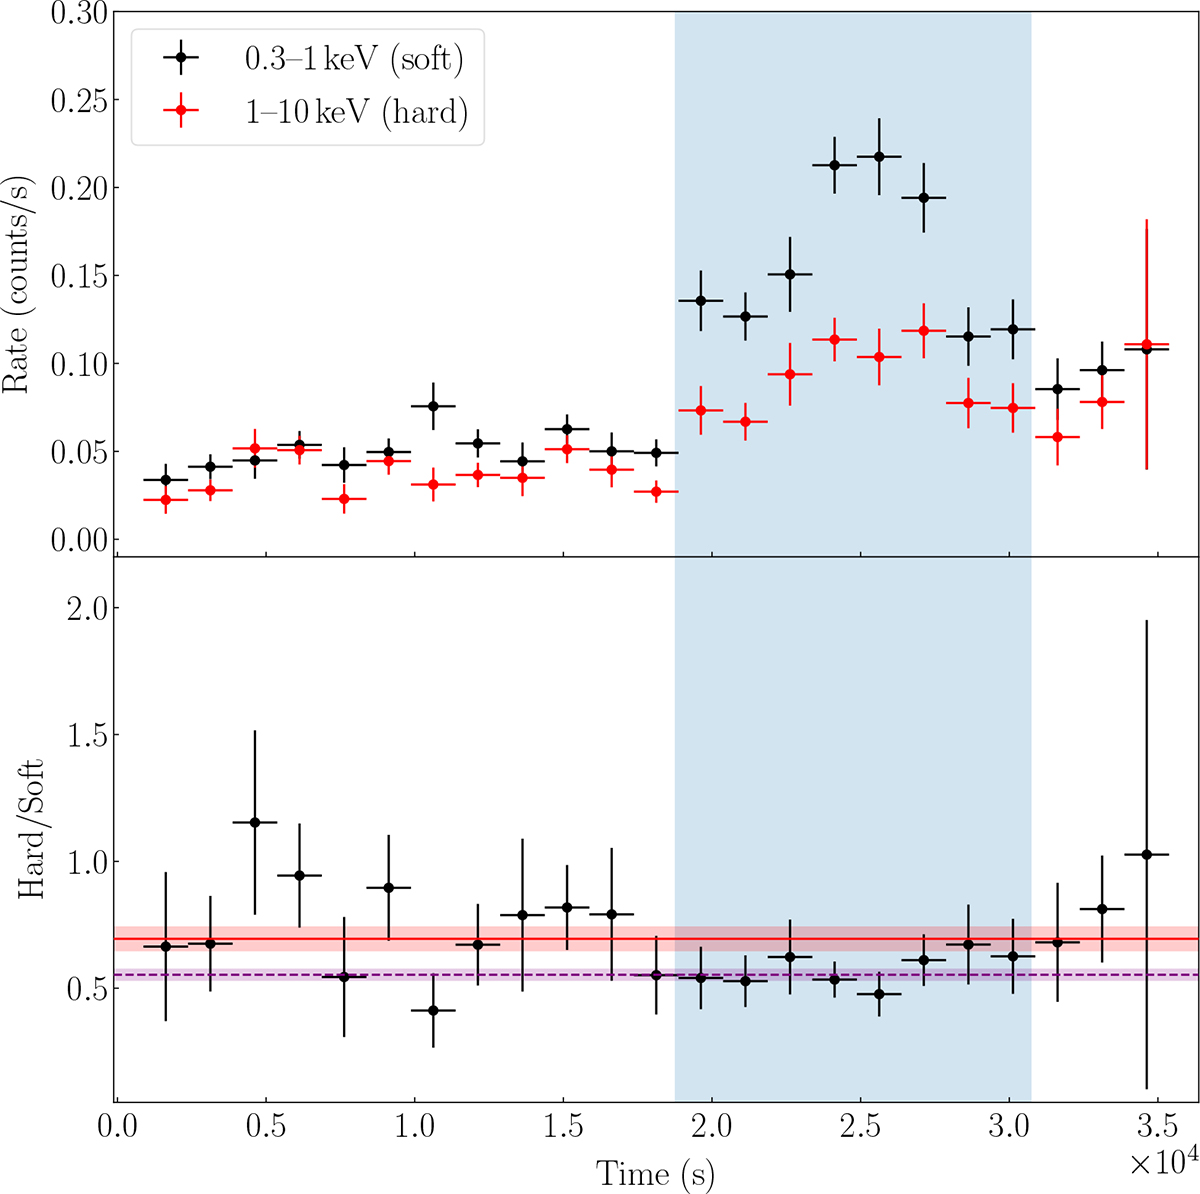
Light curve of J1257 during the XMM-Newton observation 0691610201. Top panel: Light curve in the soft (0.3–1 keV) and hard (1–10 keV) band. Bottom panel: Hardness ratio of the hard count rate over the soft count rate. The red (dashed purple) line shows the result of the fit of the hardness ratio with a constant outside (within) the high-flux phase (highlighted in blue). The corresponding shaded region shows the 1σ confidence interval. The bin time in both panels is 1500 s.
Current usage metrics show cumulative count of Article Views (full-text article views including HTML views, PDF and ePub downloads, according to the available data) and Abstracts Views on Vision4Press platform.
Data correspond to usage on the plateform after 2015. The current usage metrics is available 48-96 hours after online publication and is updated daily on week days.
Initial download of the metrics may take a while.