Fig. 5.
Download original image
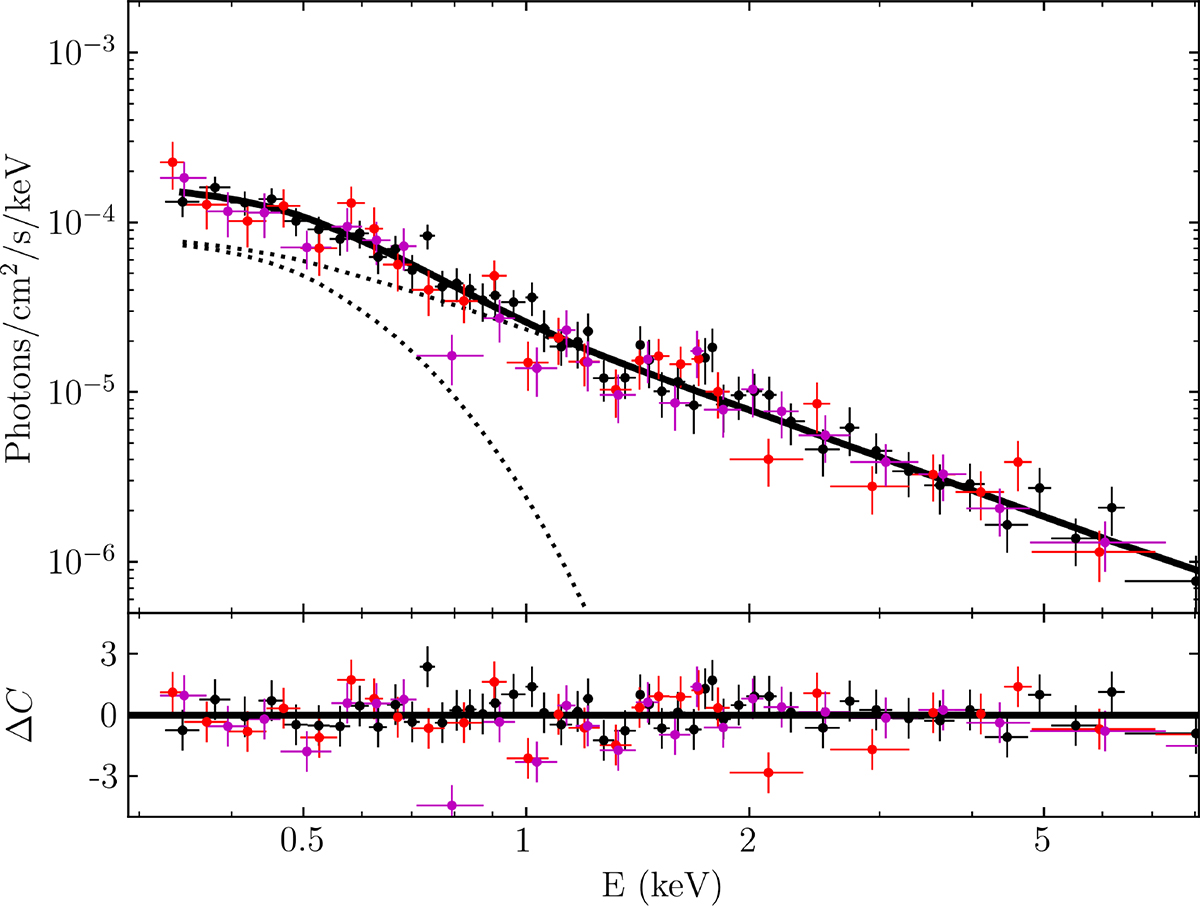
X-ray spectrum (upper panel) and residuals (lower panel) of the J1257, taken with XMM-Newton in June 2000 (ObsID 0124710101). We show data from EPIC/pn (in black), EPIC/MOS1 (in red), and EPIC/MOS2 (in magenta). The best-fitting model is shown with a solid line; the two components, black body and power-law, are shown with the dotted black lines.
Current usage metrics show cumulative count of Article Views (full-text article views including HTML views, PDF and ePub downloads, according to the available data) and Abstracts Views on Vision4Press platform.
Data correspond to usage on the plateform after 2015. The current usage metrics is available 48-96 hours after online publication and is updated daily on week days.
Initial download of the metrics may take a while.