Open Access
Fig. 8.
Download original image
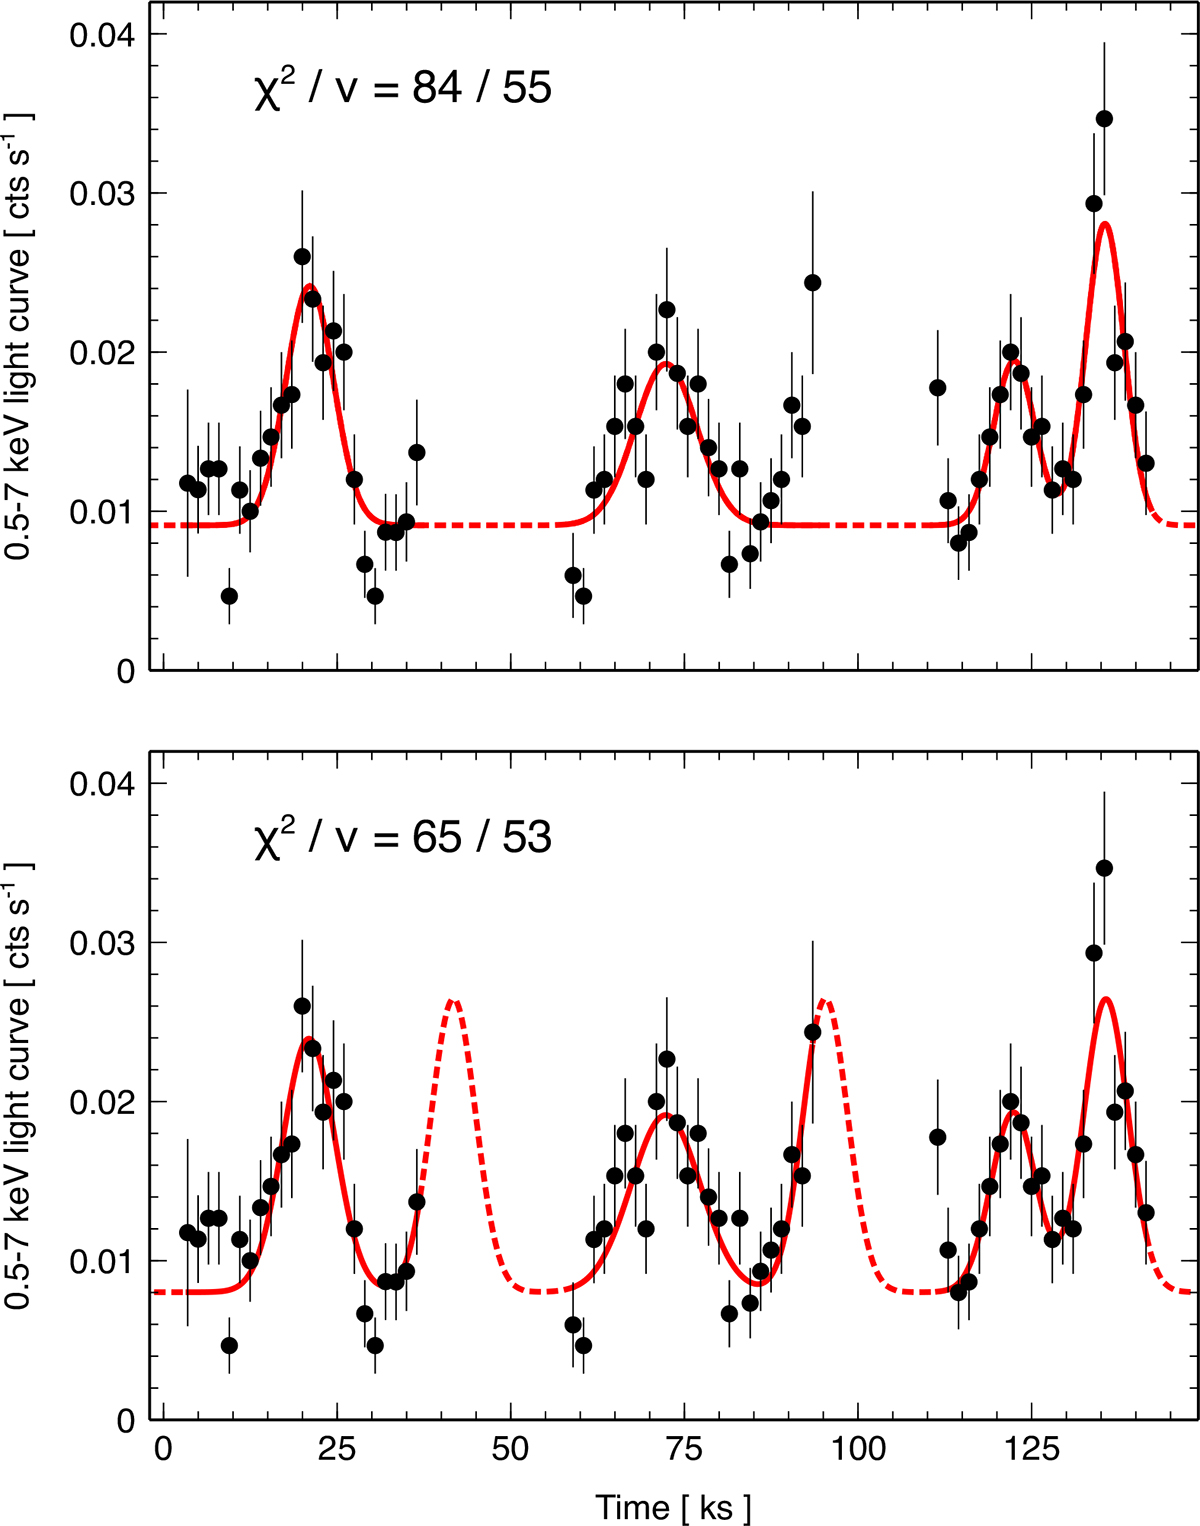
Chandra light curve in the 0.5–7 keV band of ObsIDs 22648, 22649, and 23182, as shown in Fig. 1. The upper and lower panels show in red the best-fitting model 1 and model 2, respectively (see text for details). The model extrapolation within the gaps is shown as a dotted line.
Current usage metrics show cumulative count of Article Views (full-text article views including HTML views, PDF and ePub downloads, according to the available data) and Abstracts Views on Vision4Press platform.
Data correspond to usage on the plateform after 2015. The current usage metrics is available 48-96 hours after online publication and is updated daily on week days.
Initial download of the metrics may take a while.