Fig. 9.
Download original image
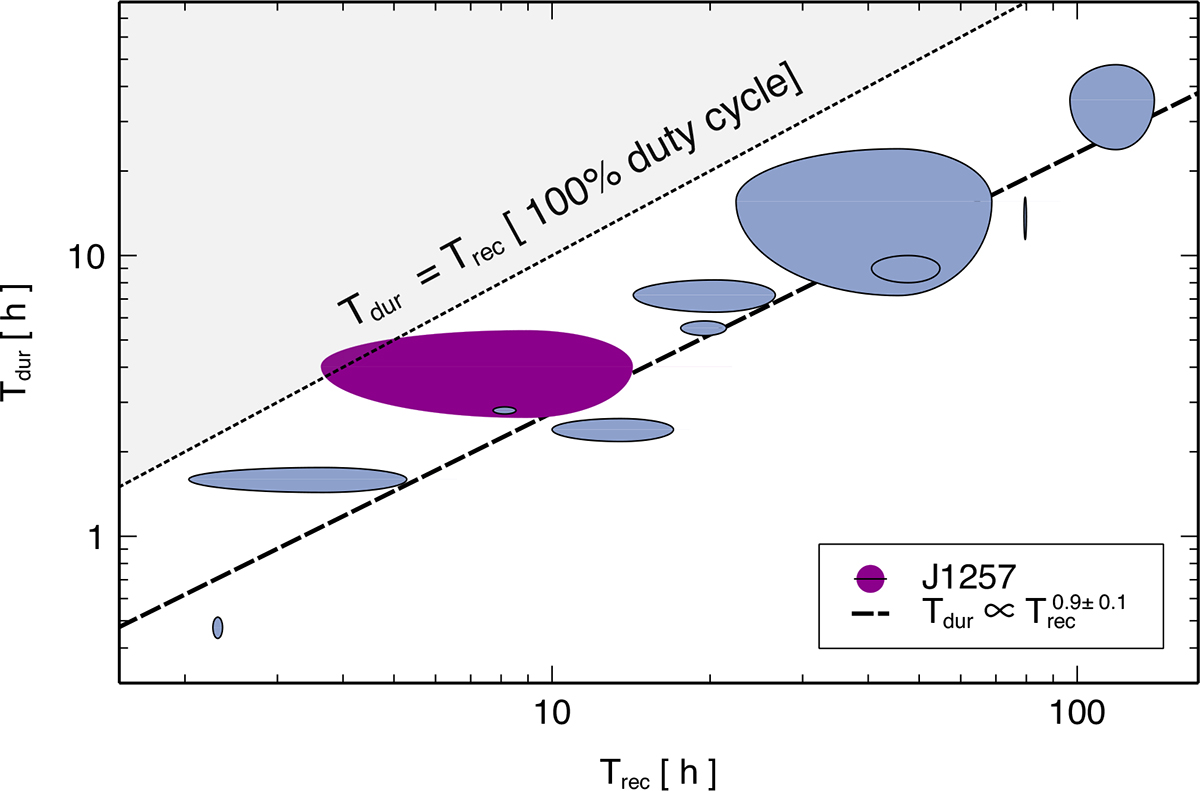
Location of J1257 (purple region) on the Tdur–Trec plane defined by the current QPE population (light blue regions). The grey area represents events with Tdur ≥ Trec that cannot be classified as well-isolated QPEs. We point out that QPEs with long recurrence times and short durations, which would populate the lower-right corner of the plane, are extremely difficult to detect; therefore, the clear correlation seen in the QPE timing plane could be affected, at least partly, by an observational bias. QPE data are taken from Arcodia et al. (2025). The dashed line is a best-fitting relation of the form ![]() resulting in p = 0.9 ± 0.1, that is, in a relation consistent with being linear.
resulting in p = 0.9 ± 0.1, that is, in a relation consistent with being linear.
Current usage metrics show cumulative count of Article Views (full-text article views including HTML views, PDF and ePub downloads, according to the available data) and Abstracts Views on Vision4Press platform.
Data correspond to usage on the plateform after 2015. The current usage metrics is available 48-96 hours after online publication and is updated daily on week days.
Initial download of the metrics may take a while.