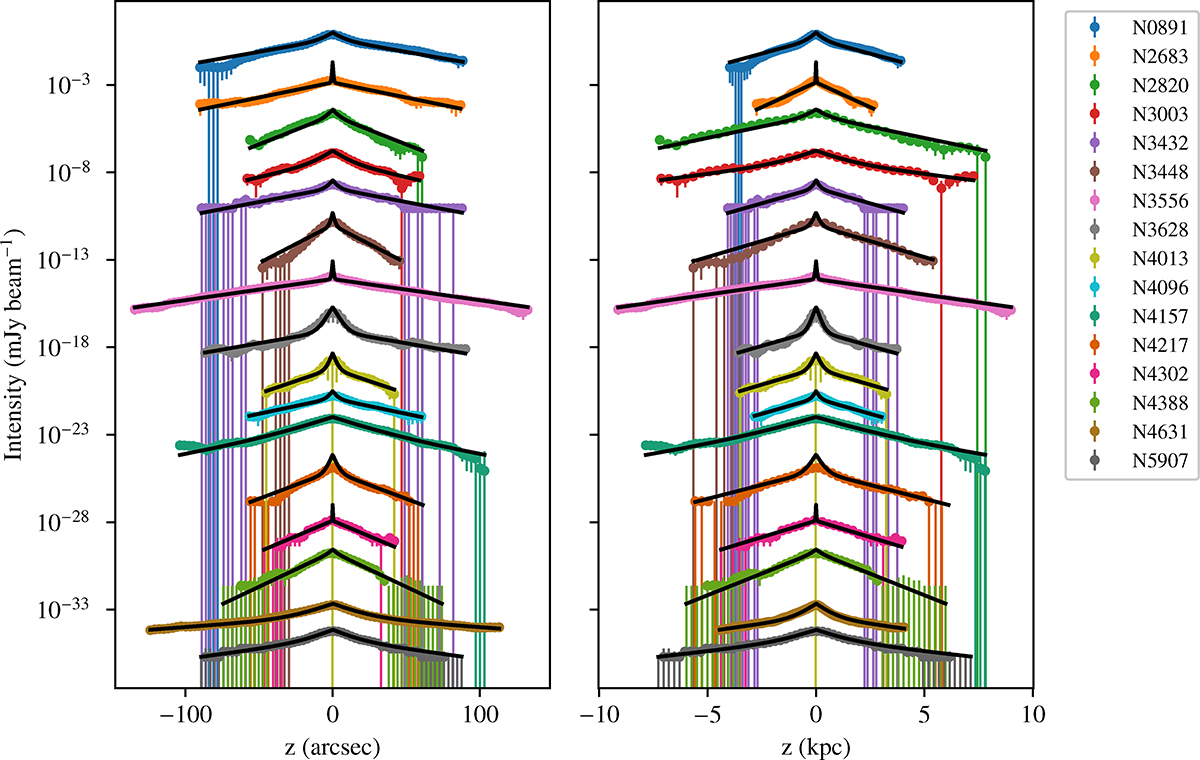
Fig. 1.
Download original image
Vertical radio continuum intensity profiles at 144 MHz of the galaxies in our sample. The intensity profiles of the central strip are given for each galaxy, with the exception of NGC 2820 and 4388 (where the profile in the eastern strip is shown). Left: Profiles in units of arcsec, the right panel shows them in units of kpc in projection of the assumed distances. Solid lines represent two-component exponential model profiles after deconvolution with the effective beam. The intensities were rescaled arbitrarily to separate the profiles for clearer visualization.
Current usage metrics show cumulative count of Article Views (full-text article views including HTML views, PDF and ePub downloads, according to the available data) and Abstracts Views on Vision4Press platform.
Data correspond to usage on the plateform after 2015. The current usage metrics is available 48-96 hours after online publication and is updated daily on week days.
Initial download of the metrics may take a while.