| Issue |
A&A
Volume 706, February 2026
|
|
|---|---|---|
| Article Number | A374 | |
| Number of page(s) | 11 | |
| Section | Extragalactic astronomy | |
| DOI | https://doi.org/10.1051/0004-6361/202557531 | |
| Published online | 20 February 2026 | |
CHANG-ES
XXXVII. Effects of spectral aging on radio scale heights
1
Hamburger Sternwarte, Universität Hamburg Gojenbergsweg 112 D-21029 Hamburg, Germany
2
Purple Mountain Observatory, Chinese Academy of Sciences 10 Yuanhua Road Nanjing 210023, China
3
Obserwatorium Astronomiczne Uniwersytetu Jagiellońskiego ul. Orla 171 30-244 Kraków, Poland
4
Ruhr University Bochum, Faculty of Physics and Astronomy, Astronomical Institute (AIRUB) 44780 Bochum, Germany
5
Department of Physics and Astronomy & Research Center of Astronomy, Qinghai University 251 Ningda Road Xining 810016, China
6
Instituto de Astrofısica de Andalucıa (IAA-CSIC), Glorieta de la Astronomía 18008 Granada, Spain
7
Department of Physics, Engineering Physics & Astronomy, Queen’s University Kingston ON K7L 3N6, Canada
★ Corresponding author: This email address is being protected from spambots. You need JavaScript enabled to view it.
Received:
2
October
2025
Accepted:
22
December
2025
Abstract
Context. Cosmic rays and magnetic fields play an important role in the formation and evolution of galaxies. Radio continuum observations enable their study in the halos of edge-on galaxies.
Aims. We explore the frequency dependence of the radio scale height which depends on cosmic ray transport and electron cooling. We test the influence of fundamental galaxy properties, such as the star formation rate (SFR), mass and size.
Methods. We used radio continuum data of 16 edge-on galaxies from the Continuum Halos in Nearby Galaxies – an EVLA Survey (CHANG-ES). We included maps from the LOw Frequency ARray (LOFAR) at 144 MHz and from the Jansky Very Large Array (VLA) at 3 GHz with 7″ angular resolution. We extracted vertical intensity profiles within the effective radio radius and fitted beam-convolved double-exponential models to separate the thin and thick discs. For the thick radio discs, we computed their mean spectral indices and scale-height ratios between 144 MHz and 3 GHz.
Results. We find a mean scale-height ratio of 1.26 ± 0.16. This is much lower than what we would expect for either cosmic ray diffusion or advection if synchrotron and inverse Compton losses dominate for the electrons. There is a moderate positive correlation between the ratio and spectral index of the thick disc: galaxies with high ratios have flat radio spectra. The ratio does not depend on any other galaxy parameter. The radio spectrum of the thick disc, as indicated by the radio spectral index, steepens with total mass (strong correlation) and flattens with SFR-to-mass surface density (moderate correlation).
Conclusions. Galaxies with galactic winds have flat radio continuum spectra and large scale heights at low frequencies. This shows effective transport of cosmic rays in such systems.
Key words: cosmic rays / galaxies: fundamental parameters / galaxies: magnetic fields / galaxies: star formation / radio continuum: galaxies
© The Authors 2026
 Open Access article, published by EDP Sciences, under the terms of the Creative Commons Attribution License (https://creativecommons.org/licenses/by/4.0), which permits unrestricted use, distribution, and reproduction in any medium, provided the original work is properly cited.
This article is published in open access under the Subscribe to Open model. This email address is being protected from spambots. You need JavaScript enabled to view it. to support open access publication.
1. Introduction
Understanding the evolution and formation of galaxies is highly complex and not yet fully understood. Galaxies assemble through the accretion of gas during the early stages of cosmic history. This gas subsequently condensed into stars that are found today in the bulge and the stellar halo. The discs in galaxies are typically a later addition, developing as material with higher angular momentum drifts into the galaxies (Ostriker & Naab 2012). This has been the prevailing theoretical framework for galaxy formation. However, recent James Webb Space Telescope (JWST) observations have revealed surprisingly massive galaxies at high redshifts that potentially challenge aspects of current galaxy formation models (Boylan-Kolchin 2023).
These findings further highlight the importance of understanding the complex baryonic processes that regulate galaxy growth and evolution. In this context, the circumgalactic medium (CGM) plays a crucial role since it forms the interface between the galaxies and their large-scale environment. Multiple processes within the CGM shape galaxy evolution. Accretion continuously supplies gas from the intergalactic medium and the infall of satellite galaxies contribute further material to the system (Hafen et al. 2019). Thermal instabilities facilitate transitions between gas phases. Galactic winds redistribute disc gas throughout the halo. Understanding these individual processes and their interplay in the CGM is crucial for developing a comprehensive picture of galaxy evolution. The CGM directly fuels star formation while simultaneously moderating feedback processes (Tumlinson et al. 2017). Detailed analysis of CGM properties (including its multi-phase structure, gas dynamics, and metallicity) requires examining both the thermal and dynamical processes, as well as non-thermal components, such as magnetic fields and cosmic rays (CRs; Ji et al. 2020; van de Voort et al. 2021). It has been shown that CR affect the accretion of gas on galaxies by modifying the CGM flow structure. Therefore, CGM densities and temperatures can be strongly affected by CR (Buck et al. 2020). Magnetic fields act as a pressure component in the CGM, which needs to be considered when determining the dynamics and structure of the CGM. Thus, magnetic fields change the properties of the CGM significantly (Pakmor et al. 2020; van de Voort et al. 2021).
To probe the CGM, radio continuum observations have proven particularly valuable. With polarised background radio galaxies, magnetic fields were detected in the CGM of highly inclined galaxies using Faraday rotation (Heesen et al. 2023). Such edge-on galaxies reveal in the radio continuum emission two distinct discs. The thin disc, with scale heights of a few hundred parsecs, consists mostly of stars, dust, and gas (Ferrière 2001). The thick disc, on the other hand, comprises mostly ionized gas, cosmic rays, and magnetic fields (Cox 2005). The thick disc is inflated by non-thermal pressures and has a different kinematic and chemical composition than the thin disc. The thick gaseous disc is the location where galactic in- and outflows can be studied. Therefore, the thick disc serves as an interface between the galaxy and the CGM. Thus, the thick disc can be used to constrain galaxy formation models (Tsukui et al. 2025).
Given the thick disc’s importance as an interface, radio continuum observations represent one of the most essential tools for understanding the influence of CRs and magnetic fields on galaxy evolution since the radio continuum is mainly made up of synchrotron radiation. However, disentangling the individual contributions of these components remains challenging, as synchrotron emission depends on both the cosmic ray population and the magnetic field strength. Radio continuum observations are particularly valuable for studying CRs, which play a dynamical role in galaxy evolution. Overall, CRs can drive galactic outflows by exerting vertical pressure gradients without significantly heating the gas (Heintz et al. 2020). Although only ∼10% of a supernova remnant’s kinetic energy is converted into acceleration of CRs, they have a disproportionate impact on galactic dynamics. This is because CRs are transported away from their injection sites in star-forming regions and subsequently establish vertical pressure gradients that drive galactic winds (Girichidis et al. 2018).
With the Continuum Halos in Nearby Galaxies an EVLA Survey (CHANG-ES), it is possible to study the role of CRs in galaxy evolution using a sample of 35 edge-on galaxies. CHANG-ES is a radio continuum survey that observed these galaxies in the L (1–2 GHz), S (2–4 GHz), and C bands (4–6 GHz), with full polarisation data available. The survey has already yielded important insights into the structure and dynamics of the extra-planar interstellar medium, cosmic ray transport, and magnetic field configurations in nearby galaxies. In particular, Faraday rotation analyses have revealed large-scale magnetic field structures such as kiloparsec-scale magnetic ropes in NGC 4631 (Mora-Partiarroyo et al. 2019a) and a quadrupolar field geometry in NGC 4666 (Stein et al. 2019a), consistent with expectations from dynamo theory (Henriksen 2022). A systematic Faraday rotation study across the entire CHANG-ES sample confirmed the prevalence of X-shaped magnetic fields likely associated with galactic winds (Krause et al. 2020), further explored in Stein et al. (2025). Spectral ageing studies, especially in combination with low-frequency LOFAR data (Van Haarlem et al. 2013), have allowed for detailed investigations of cosmic ray electron transport from the disc into the halo (Schmidt et al. 2019; Stein et al. 2019a,b; Miskolczi et al. 2019; Heald et al. 2022; Stein et al. 2023). These results were supported by a scale height analysis by Krause et al. (2018), who showed that the escape of cosmic ray electrons is possible, indicating that the galaxies in the sample are non-calorimetric.
In this work, we build on the study of Krause et al. (2018), who measured scale heights of the thick radio disc in both L and C bands. Instead of using these two bands, we make use of the new S band data, extending the existing CHANG-ES survey, as well as LOFAR observations of the galaxies at 144 MHz. The addition of the S band data enriches the CHANG-ES survey (Heesen et al. 2025). This frequency band lies in the important transition region between Faraday-thin and Faraday-thick regimes. While we do not use the polarisation information in this study, we benefit from S band’s higher angular resolution and sensitivity. The LOFAR observations allow us to observe the same galaxy sample at much lower frequencies of 144 MHz. These measurements, taken as part of the LOFAR Two-metre Sky Survey (LoTSS; Shimwell et al. 2022) are roughly a factor of 20 lower in frequency than the S band allowing us to probe the cosmic ray electrons that have undergone significant spectral aging.
This paper is organised as follows. In Sect. 2, we describe our sample selection, data reduction, and methodology. In Sect. 3, we present the results and in Sect. 4. We present our conclusions and outlook in Sect. 5.
2. Data and methodology
2.1. Data
For this study, similarly to the approach taken by Heesen et al. (2025), we used radio-continuum data observed with the Jansky Very Large Array (JVLA) in the S band (i.e. in the frequency range of 2–4 GHz) and data as part of the LOFAR Two-metre Sky Survey (LoTSS), in the frequency range of 144 MHz. For the JVLA data, we used the C configuration, resulting in a nominal resolution of 7″ using Brigg’s robust weighting. The S band data have a field of view of 15′. The largest angular scale that could be imaged is  . Observations were done in the standard fashion with 2048 channels, each 100 kHz in bandwith. For the S band data, we used the reduced data, which have also been used in Heesen et al. (2025). The LoTSS survey use the LOFAR High Band Antennas, using a frequency range of 120–168 MHz and relying exclusively on the Dutch array stations, yielding a nominal angular resolution of 6″ (Shimwell et al. 2022). In its second data release (DR2), LoTSS covers about 27% of the northern sky. For comparison with the JVLA data, we convolved the LoTSS maps to 7″ resolution using IMSMOOTH within CASA. We identified suitable mosaics in LoTSS-DR2 (Shimwell et al. 2022) for the following 15 galaxies from the CHANG-ES sample: NGC 891, 2683, 2820, 3003, 3432, 3448, 4013, 4096, 4157, 4217, 4302, 4388, 4631, and 5907. Although NGC 3628 is not included in LoTSS-DR2, we identified a mosaic for this galaxy in LoTSS-DR3. The remaining CHANG-ES galaxies either lie at declinations too far south to be observed with LOFAR or lack mosaics of sufficient quality for our analysis. To ensure the comparability between the JVLA S band dataset and the data from LOFAR, we checked on inconsistencies in sensitivity and resolution between the two telescopes. For JVLA S band in the C configuration, the largest angular scale is 490″. There are four galaxies in the data sample that are more extended than the largest angular scale: NGC 891, 3628, 4631, and 5907. If flux was missing, we would expect to see large scale height ratios for all of these galaxies; however, we found no such trend. For LOFAR, the largest angular scale is not a limiting factor, as the shortest baselines are sufficiently small. To assess the sensitivity, we examined the extent of the measured profiles and found them to be comparable to those presented in Heesen et al. (2025). Furthermore, the measurement of scale heights is robust against moderate sensitivity variations, as they were derived from fitting procedures.
2.2. Intensity profiles
We created vertical intensity profiles by averaging the emission within boxes arranged in strips perpendicular to the major axis of each galaxy. This approach follows the methodology described in Krause et al. (2018). For each galaxy, we defined three strips along the major axis: one centred on the galaxy and two placed symmetrically at larger galactocentric distances. In some cases, however, we could not derive scale heights in all strips due to limitations in data quality. For measuring the scale heights, we use the function BOXMODELS of the program package NOD3 (Müller et al. 2017). To create the intensity profiles required for this analysis, it is necessary to define the size and placement of the boxes used for averaging the emission. We set the total width of the three strips to correspond to the effective diameter (e-folding diameter) of the galaxy in the radio continuum, which we determined by placing a 10 arcsec wide strip along the major axis and fitting a Gaussian profile to the radio continuum emission to obtain the effective radius re. Each strip was assigned a width of 2/3 re. Within these strips, we averaged the intensities in boxes with widths equal to the strip width and heights of 3″, corresponding to approximately half of our angular resolution. We fitted exponential functions to the vertical intensity profiles to determine the scale heights of the thin and thick discs. Since the angular resolution is limited, we need to account for the effective beam. The effective beam combines the clean beam (intrinsic resolution) and the projection of the inclined disc along the minor axis. The model profiles are thus the convolution of an exponential distribution with a Gaussian describing the effective beam, following the analytic approach by Dumke et al. (1995). In Fig. 1, we show the vertical radio continuum profiles for the galaxies of our sample at LOFAR frequencies of 144 MHz. Typically, we took the middle strip, except for NGC 2820 and 4388, where the middle strip had problems with proper fitting. These profiles reveal that the vertical emission cannot be described by a single exponential function. In the linear-log representation, a single exponential would appear as a straight line, yet our data clearly exhibit changes in slope indicating more than one emission component. While some galaxies such as NGC 3628 display sharp breaks between components, others such as NGC 4157 exhibit more gradual transitions. Thus, we can observe both the thin and thick discs and are able to separate them using double exponential fitting. We chose to not apply a correction on the impact of the thermal emission as done, for example in Stein et al. (2023). Stein et al. (2019a) showed that non-thermal fractions for the C band lie in regions around 85%, and for the L band, this is around 95%. Thus, the S band might thus lie somewhere between and, at LOFAR frequencies non-thermal fractions might be even higher. Tabatabaei et al. (2017) found similarly small contributions of thermal emission (see also Galvin et al. 2018; Dey et al. 2024). Furthermore, we expect to see less thermal emission in the halo of the galaxies (Klein et al. 2018). Even though, there might be lower non-thermal fractions locally (Irwin et al. 2024), global non-thermal fractions in the halo are usually high and the thermal emission only offers a minor contribution. We checked on the assumption that the thermal emission plays only a minor role in the thick disc by subtracting the thermal emission using maps from Stein et al. (2023). They show maps for five galaxies of our sample: NGC 891, 3432, 4013, 4157, and 4631. The maps have a resolution of 20″. For galaxies with scale heights greater than the resolution of the thermal maps, we find that the differences between scale heights measured on the total emission versus just the non-thermal emissions differs in average around 10%. This lies within the average error of the scale heights for these galaxies. For NGC 4013, the scale height of the thick disc is smaller than the resolution of the thermal maps. Measuring the scale height in that case leads to an unphysical high scale height. Therefore, we see that in general the contribution of thermal emission in the thick disc is suppressed compared to the thin disc and the need for highly resolved H I and Hα maps to correctly compute the thermal substraction.
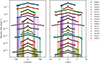 |
Fig. 1. Vertical radio continuum intensity profiles at 144 MHz of the galaxies in our sample. The intensity profiles of the central strip are given for each galaxy, with the exception of NGC 2820 and 4388 (where the profile in the eastern strip is shown). Left: Profiles in units of arcsec, the right panel shows them in units of kpc in projection of the assumed distances. Solid lines represent two-component exponential model profiles after deconvolution with the effective beam. The intensities were rescaled arbitrarily to separate the profiles for clearer visualization. |
2.3. Integrated intensity profiles and scale height ratios
To calculate the spectral index of the thick disc for the galaxy sample, we computed the integrated flux densities by integrating the intensities along the vertical direction. By using the effective radius of the galaxy, the radio continuum emission can be deprojected in order to obtain the mean deprojected intensity as it would appear in a face-on-galaxy. Thus, we have
 (1)
(1)
where Ii is the deprojected mean intensity, wi is the amplitude in units of mJy beam−1, zi is the scale height in units of arcsec, and re is the effective radius in arcsec. The index, i, denotes the components of the radio emission, namely, the thin and thick disc. Combining both I = Ithin + Ithick yields the total mean intensity of the galaxy in the radio continuum. In the following, we only include results for the thick disc because the scale heights in the thin disc are characterised by overly high relative errors to calculate ratios and spectral indices. To calculate the spectral index of the thick disc, we computed the deprojected mean intensity of the thick disc. The spectral index of the thick disc is then given by
 (2)
(2)
where Iν1 and Iν2 are the deprojected mean intensities at the frequencies ν1 and ν2, respectively; in our case, we have ν1 = 144 MHz from LOFAR and ν2 = 3 GHz from the VLA S band. We measured the spectral index of the thick disc for each strip in every galaxy individually. The uncertainty of each spectral index was derived via error propagation of the measurement errors of the amplitude, w, and the scale height, z, in both, the LOFAR and VLA S band data. To obtain a global spectral index per galaxy, we combined the spectral indices measured in the individual strips using an inverse-variance weighting (1/σi2). The weighted mean and the corresponding corrected standard deviation were calculated with the DescrStatsW routine from statsmodels (Seabold & Perktold 2010). This Python library offers statistical tests, models, and data exploration, with DescrStatsW providing descriptive statistics such as weighted means and standard deviations for weighted datasets. An analogous procedure was applied to the ratio of the scale heights, determining the ratios for each strip and combining them into a global value for each galaxy. The weighted mean and its corrected standard deviation were again calculated with the DescrStatsW routine from statsmodels.
3. Results
3.1. Scale height ratios
First, we investigated the scale height ratios of the thick radio disc between LOFAR observations at 144 MHz and VLA S band observations at 3 GHz. The scale heights measured in the VLA S band for the set of CHANG-ES galaxies can be found in Heesen et al. (2025). We show the measured scale height ratios between JVLA S band data and LoTSS data in Fig. 3. For this set of galaxies, we found a mean scale height ratio of 1.26 ± 0.16. With a ratio of 0.98 ± 0.32, NGC 5907 has the smallest ratio in the set of galaxies. Most galaxies have scale height ratios of below 1.5. There are three galaxies with a scale height ratio bigger than 1.5, the highest scale height ratio (1.83 ± 0.23) can be found for NGC 4631.
In Fig. 4, we present the relations between the scale height ratio and fundamental galaxy properties, such as total mass, star-forming radius, SFR surface density within r★, total mass surface density scaled to our distances, ratio of SFR-to-mass surface density, and SFR. We tested for significant correlations between the different properties and the scale height ratio using Spearman’s rank correlation test (p < 0.05). Previous studies report correlations between these distinct galaxy properties and scale heights. Krause et al. (2018) and Galante et al. (2024) found that there is a positive correlation between the radio-disc diameter and the scale height. Heesen et al. (2025) also found a strong positive correlation between star forming radius and scale height. In Heesen et al. (2025), it also has been shown that for the thick disc there is a correlation between the SFR and the scale height, a negative correlation between the mass surface density and the scale height and a moderate positive correlation between SFR-to-surface density. However, in our analysis of scale height ratios, none of the investigated galaxy properties showed a statistically significant correlation with the scale height ratio.
3.2. Spectral index of the thick disc
Here, we address the relations found between the spectral index measured in the thick disc, the fundamental galaxy quantities and the scale height ratio of the thick disc. By computing the integrated intensities, we are able to measure the spectral index between 144 MHz and 3 GHz. In Fig. 5, we present the spectral index of the thick disc measured in the galaxies. In our sample of CHANG-ES galaxies, we found an arithmetic mean spectral index of the thick disc of −0.72 ± 0.09. The lowest spectral index is measured for NGC 5907 (−0.97 ± 0.11). The highest spectral index is measured for NGC 4631 (−0.58 ± 0.03). Overall, we find a spectral index still close to the injection spectral index, which is within the range expected when ionization or leakage losses play a role (Longair 2011).
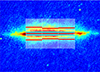 |
Fig. 2. Location of the strips and boxes used for fitting vertical radio continuum intensity profiles overlaid on the LOFAR map of NGC 891. The red lines denote the measured scale heights of the thick disc for each strip, the blue lines denote the measured scale heights of the thin disc for each strip. We use three strips with a width in terms of the effective radius re of 2/3 re. For NGC 891, we calculate the average intensity in 60 boxes per strip, each box with a height of 3″, corresponding to approximately half of our angular resolution. |
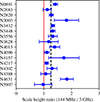 |
Fig. 3. Ratio of scale heights of LOFAR observations at 144 MHz and VLA S band observations with errors for all galaxies of the sample. The dotted black line indicates the mean scale height ratio of the galaxies in the sample. |
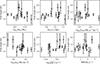 |
Fig. 4. Scale height ratio plotted against different galaxy properties. The panels show the scale height ratio versus total mass (Makarov et al. 2014), star forming radius(Wiegert et al. 2015), SFR surface density within r★ (Heesen et al. 2025), total mass surface density scaled to our distances (Irwin et al. 2012), ratio of SFR-to-mass surface density, and SFR from Hα and mid-infrared (Vargas et al. 2019). Data points represent the galaxies in our sample with their associated uncertainties. |
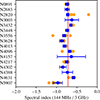 |
Fig. 5. Spectral index of the thick disc measured between LOFAR observations at 144 MHz and VLA S band observations with errors for all galaxies of the sample. The red line represents the mean spectral index of the galaxy sample. The yellow points represent the measured spectral index in the different strips. The blue points (with error bars) denote the inverse-variance-weighted mean per strip and its standard error. |
In Fig. 6, we show the spectral index of the thick disc plotted against the same properties as for the scale heights. We found a significant correlation (p-value of p < 0.05) for the total mass to spectral index. The correlation we find is strongly negative with ρs = −0.64. Similarly to the approach we have found in this work, Heesen et al. (2022) also reported a strong correlation between the total mass and the spectral index. We also found a significant correlation for the ratio of SFR-to-mass surface density and the spectral index. We found with ρs = 0.51 a strong positive correlation between both quantities. In addition, Heesen et al. (2025) found a moderate positive correlation for the SFR-to-mass surface density with scale height of the thick disc. There might also be a correlation between the SFR surface density within r★ and the spectral index (p = 0.07, ρs = 0.47). With p being slightly higher than 0.05, the correlation might not be as significant as for the ratio of SFR-to-mass surface density. With ρs = 0.47, we see a moderate correlation strength between the SFR surface density within r★ and the spectral index. From the plotted data, we could speculate that the spectral index increases up to a value of about 10−2.5 M⊙ yr−1 kpc−2 and then remains approximately constant. Tabatabaei et al. (2017) find a similar trend. The correlation shows that the cosmic ray electron (CRE) population in galaxies with higher SFR is younger and, therefore, the spectral index flat. Less star formation (i.e. less supernova feedback) leads to an aging population of CRE and, therefore, a steeper spectral index. However, more data are required to confirm this trend. For the star forming radius, there might be hints that there could be a weak correlation with the spectral index, but we are not able with our data to show a significant correlation (ρs = −0.34, p = 0.20). We also find no correlation of the spectral index with the total mass-surface density (ρs = −0.03, p = 0.92) or with the SFR (ρ = −0.08, p = 0.78).
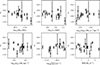 |
Fig. 6. Spectral index of the thick disc plotted against different galaxy properties. The panels show the spectral index versus total mass (Makarov et al. 2014), star forming radius (Wiegert et al. 2015), SFR surface density within r★ (Heesen et al. 2025), total mass surface density scaled to our distances (Irwin et al. 2012), ratio of SFR-to-mass surface density, and SFR from Hα and mid-infrared (Vargas et al. 2019). Data points represent the galaxies in our sample with their associated uncertainties. |
3.3. Comparing scale height ratio and spectral index of the thick disc
In this section, we describe how we combined the measurements of the scale height ratio and the spectral index of the thick disc. By combining both measurements, we expect to probe the influence of spectral aging on the extent of the thickness of the radio emitting halo at different frequencies. These combined observables provide constraints on the dominant CR transport processes. In Fig. 7, we present the scale height ratio plotted against the spectral index of the thick disc. We show both the variance-weighted mean of all strips for each galaxy with the corresponding errors and the individual measurements of each strip. We indicated the central strip of the galaxies with a black circle. For the galaxies where the northern and southern halo are fitted individually, there are two central strip fittings, both included in the plot.
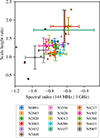 |
Fig. 7. Scale height ratio plotted against the spectral index of the thick disc measured between LOFAR and VLA S band data. Squares indicate the variance-weighted mean of all strips for each galaxy with the corresponding error bar, while dots show the individual strip measurements (errors omitted for clarity). The black circles indicate the central stip of the galaxy. If northern and southern halo are fittet individually, there are two central strips for the corresponding galaxy and both are indicated in this plot. |
We see a significant moderate correlation between both quantities. However, in contrast to our expectations, the correlation is positive and not negative, which we would expect if spectral aging was determining the scale height ratio. Measured only for the variance-weighted mean of all strips, we find a significant moderate positive correlation with ρs = 0.49 and p = 0.05. Applying Spearman’s rank correlation test directly onto the measured values results in improved correlation coefficients of ρs = 0.49 and p = 6.5 × 10⁻⁴. For the central strips, however, we do not find any systematic trend; they are not consistently higher or lower than the remaining strips of a given galaxy. The error bars on NGC 4157 might be high in the spectral index but still in combination with the data points of NGC 3003 and 4631, it seems plausible that there are galaxies that have a spectral index close to the injection spectral index, and at the same time, also exhibit a high scale height ratio. Although we find a moderate correlation, it might be useful to think the correlation in regimes of CR transport. There are galaxies in the sample which have high scale height ratios and flat spectral indices, most prominent NGC 3003, 4157, and 4631. Stein et al. (2023) reported, similarly to what we found that for NGC 4631 and NGC 4157, the radio scale heights measured at low frequencies exceed those at higher frequencies. Stein et al. (2023) explain this behavior with advection-dominated galactic winds. As a consequence of winds playing a major role for these galaxies, the spectral index becomes flat. For NGC 4631, the gravitational interaction with NGC 4627 might be a reason for the strong winds. For NGC 3003, Lu et al. (2023) found high scale heights in Hα and H I, which fits in the picture of a extended thick disc with winds. Stein et al. (2023) also reported enhanced low-frequency scale heights in NGC 891, again attributing them to the presence of a wind. In our analysis, NGC 891 likewise exhibits elevated values, although they do not quite reach the levels observed for NGC 3003, 4157, and 4631. On the other side of the parameter space, we have galaxies such as NGC 3628 and 5907, which are characterized by steep spectral indices and comparatively low scale height ratios. We found for NGC 3628 and 5907 spectral indices fairly close to α = −1.1. An integrated radio spectral index of α ≈ −1.1 is the theoretically expected integrated radio spectral index for a perfectly calorimetric galaxy (Lisenfeld et al. 1996). Therefore, we identified NGC 3628 and 5907 as being close to calorimetric halo. Scale height ratios that are close to unity suggest that even older CRE populations do not extend the thick disc further, implying that CREs are not escaping. With an arithmetic mean value of −0.72 ± 0.09, most galaxies lie between of the injection spectral index of α ≈ −0.6 (Lacki & Thompson 2013) and the spectral index of a calorimetric halo of α ≈ −1.1. This suggests that cosmic-ray electron transport along density gradients is plausible, which is also reflected in the scale height ratios of 1.26 ± 0.16.
4. Discussion
4.1. Physical quantities of the individual galaxies
Within our sample of galaxies, we found differences in the scale height ratios and spectral indices, which reflect variations in the underlying CRE transport. To understand the differences, we took a closer look on the individual galaxies in our sample. In the following, we refer to the term spectral index of the thick disc simply as spectral index for brevity.
NGC 891 is one of the larger galaxies in the sample, with the third highest mass (Table A.1). Stein et al. (2023) found that the galaxy shows extended low-frequency scale heights which indicates winds. Similarly, we also found an increased scale heights at low-frequencies for NGC 891, although the scale height is not as high as for example for NGC 3003, 4157, or 4631 which are also noted for their large scale heights in Lu et al. (2023), Stein et al. (2023). The spectral index of NGC 891 (Table A.1) is close to the mean spectral index in our sample of −0.72 ± 0.09. Thus, unlike NGC 3003, 4157, or 4631, the spectral index of NGC 891 is not as close to the injection spectral index.
NGC 2683 is one of the galaxies in our sample that has an active galactic nucleus (AGN) (Heesen et al. 2022). Of all galaxies of our sample, NGC 2683 has the smallest star-forming radius, the highest total mass surface density, and the smallest SFR-to-mass surface density and SFR. The scale height ratio is slightly below the average of the sample. The spectral index is close to the average of the sample, so in between of aging and the calorimetric halo.
NGC 2820 represents an average case in our sample. Its scale height ratio is close to the average, the spectral index lies between the injection spectrum and the calorimetric limit, while the other galaxy properties also displays values that are typical for our sample.
NGC 3003 has in our sample the second highest scale height ratio. Lu et al. (2023) showed that the galaxy shows even in Hα and H I large scale heights, indicating an extended halo. NGC 2820 has a spectral index close to the injection spectral index and the lowest lowest SFR surface density within r★ of the galaxies in the sample.
NGC 3432 is the galaxy with the lowest total mass in our sample. It has a spectral index close to the injection spectral index and has scale height ratio slightly above the average of the sample but smaller than the scale height ratio of NGC 3003, 4157, and 4631.
NGC 3448 represents another average case in our sample. Its scale height ratio is close to the average, the spectral index lies between the injection spectrum and the calorimetric limit, and the other galaxy properties also take values typical for our sample.
NGC 3556 is one of the galaxies in our sample which might have an AGN (Satyapal et al. 2008). It is one of the more massive galaxies in our sample and has the biggest SFR-to-mass surface density. The spectral index is steeper than the average spectral index. The scale height ratio is close to the average scale height. An interesting feature about this galaxy are the differences measured between the strips in the galaxy. There are two strips that display different behaviors. One strips shows low scale height ratios and a steep spectral index, the other strip shows a flat spectral index and high scale height ratios. This might be an indication that even within galaxies the transport mechanism does spatially differ.
NGC 3628 is the second most massive galaxy in our sample and has the second-largest star-forming radius, r★, both only surpassed by NGC 5907. It also exhibits the second-steepest spectral index and the second-lowest SFR surface density within r★ (again after NGC 5907). The scale height ratio of NGC 3628 is smaller than the average scale height ratio of the sample. NGC 3628 also shows signs of gravitational interactions. Li & Wang (2013) found X-ray emissions for this galaxy, which suggest a large outflow-like halo, which appears surprising in connection with the steep spectral index. We found a higher scale height ratio for the central strip, so it might be reasonable to speculate about a nuclear outflow in the central strip.
NGC 4013 represents another average case in our sample. Its scale height ratio is close to the average, the spectral index lies between the injection spectrum and the calorimetric limit, and the other galaxy properties also take values typical for our sample.
NGC 4096 represents mostly another average case in our sample. The spectral index of NGC 4096 is slightly flatter than the average value. The scale height ratio is slightly smaller than the average value. The star-forming radius is comparatively small.
NGC 4157 has the third highest scale height ratio in combination with a flat spectral index, close to the injection spectral index. Similarly to what we found in our study, Stein et al. (2023) reported that the radio scale heights at low-frequencies exceed their high-frequency counterparts. The other galactic properties show typical values for our sample.
NGC 4217 represents another average case in our sample. Its scale height ratio is close to the average, the spectral index lies between the injection spectrum and the calorimetric limit, and the other galaxy properties also take values typical for our sample. For NGC 4217, Heesen et al. (2024) found a 20 kpc radio bubble as third component besides the thin and thick disc. In our fit, we considered only the thin and thick disc.
NGC 4302 has a relatively steep spectral index, indicating spectral aging of CRE. The scale height ratio is close to the average value of the sample. NGC 4302 has the second lowest ΣSFR. The other properties show typical values for our sample. Edler et al. (2024) reported radio continuum tails in NGC 4302 and suggested that the galaxy might host an AGN. In addition, NGC 4302 interacts gravitationally with NGC 4298 and Zschaechner et al. (2015) found a bridge connecting both galaxies.
NGC 4388 has a small scale height ratio close to 1. The spectral index is close to the average of the sample. NGC 4388 is a Seyfert-2 galaxy (Hummel & Saikia 1991). We find no strong effect from the AGN on our results. In our sample, NGC 4388 has the largest SFR surface density within r★ and the second largest SFR-to-mass surface density of the galaxies in the sample.
NGC 4631 has the highest scale height ratio and the flattest spectral index in our sample. NGC 4631 is influenced by tidal forces due to the interaction with its neighbor NGC 4627. The large scale heights at low frequencies are also discussed in Stein et al. (2023). NGC 4631 has a relatively low ratio of SFR-to-mass surface density, the second highest SFR and the second lowest total mass surface density. Mora-Partiarroyo et al. (2019b) found in NGC 4631 large-scale magnetic field reversals.
The scale height ratio of NGC 5907 is slightly lower than 1 and, hence, the smallest scale height ratio in the galaxy sample. With a spectral index close to −1, the galaxy nearly has the theoretically expected spectral index for a perfectly calorimetric galaxy. NGC 5907 is the most massive galaxy of the sample, with the largest star-forming radius in the sample, and the lowest SFR surface density within r★ of the sample.
4.2. Galactic winds
Galactic winds are extended outflows of cosmic rays, hot ionized plasma, cold neutral gas, and magnetic fields, driven by intense star formation and AGN (Thompson & Heckman 2024). With galactic winds as the dominant transport mechanism, populations of cosmic-ray electrons are advected through the thick disc before synchrotron and inverse-Compton losses can significantly age the spectrum, resulting in a radio spectral index close to the injection value. In our sample of galaxies we found multiple galaxies that show a spectral index near the injection index (α ≈ −0.6), with galactic winds as a plausible transport mechanism. Additionally, for NGC 4631, the large-scale magnetic field reversals (Mora-Partiarroyo et al. 2019b) might provide good conditions for reconnection heating (Weügowiec et al. 2022). In the case that large-scale bubbles rise into the halo, the adjacent magnetic field lines reconnect leading to increased efficiency in the transport of CRE (Mulcahy et al. 2017). In our sample of galaxies, we also found systems with steep spectral indices, close to α ≈ −1.1. Such steep spectra are expected for calorimetric galaxies, where cosmic-ray electrons are confined and radiative losses dominate (Lisenfeld & Völk 2000). For the calorimetric galaxies, we find additionally low scale height ratios. This supports the interpretation that cosmic rays are confined, reaching the thick disc but being prevented from escaping by radiative losses. In these calorimetric systems, a fountain-like behavior seems plausible. The cosmic-ray electrons reach certain height in the halo but eventually return, rather than escaping. This picture is reinforced by the fact that the galaxies we classify as calorimetric (e.g. NGC 3628 and 5907) are among the most massive in our sample. The galaxies in our sample with galactic winds as dominant transport mechanism show relatively high scale height ratios. Although advection suppresses strong spectral ageing, the combination of radiative losses and vertical transport during the outflow produces the observed high scale height ratios. Therefore, we argue that if cosmic ray transport happens, the dominant transport mechanism in our sample of galaxies is advection. Theoretically, ignoring magnetic field decline, the scale heights in galaxies with advective transport are expected to follow the relation,
 (3)
(3)
where h is the scale height, ν is the frequency, and B is the magnetic field strength. Under the assumption of a constant magnetic field, the scale height fraction should, in the case of advective transport, only depend on the frequency ratio,
 (4)
(4)
With a frequency ratio of roughly 20, we expect a scale height ratio of ∼4.5 in the case of advective transport. All galaxies in our sample show scale height ratios that are lower than this value.
A plausible explanation for smaller scale height ratios than expected from frequency ratios are dominant adiabatic losses. The synchrotron scale height is proportional to the product of the effective CRE lifetime and the advection speed. When adiabatic losses dominate, where the timescales are energy independent, the effective CRE lifetime becomes nearly energy independent, resulting in similar scale heights at different frequencies and, thus, scale height ratios close to unity. Therefore, the scale height ratio decreases to values below the theoretical value, in our case ∼4.5. Diffusion does not appear to play a significant role in our sample. The vertical intensity distributions are well fitted by exponential profiles, while purely diffusive transport would yield Gaussian profiles (Heesen et al. 2016; Stein et al. 2019a). This is also consistent with simulations, which have shown that diffusion is too weak to explain CR transport in extraplanar regions, where advection and streaming dominate (Hix et al. 2025). Recent studies based on multi-wavelength data emphasize the importance of pressure balance in driving galactic winds (Li et al. 2024b). In particular, the pressure equilibrium between the different phases, including the hot gas, cosmic rays, and magnetic fields, plays a crucial role in driving galactic winds. Lu et al. (2023) showed comparisons between scale heights and the different phases. They found that thermal and non-thermal electrons show almost the same spatial distributions. Thus, advection in galactic winds might be the dominant transport mechanism. Furthermore this indicates that the thermal gas, cosmic rays, and magnetic field may be close to energy equipartition. Li et al. (2024b,a) show for the galaxies NGC 3079 and 3556 the balance in pressure for the different phases.
When compared to Heesen et al. (2022), we also found that spectral index depends on total mass with more massive galaxies having steeper spectra. Higher mass could imply a deeper gravitational potential, more optimally confining CREs, and leading to increased spectral aging. Furthermore, we found that galaxies with high SFR-to-mass surface densities have flatter spectra; these galaxies have also larger scale heights (Heesen et al. 2025). A higher SFR-to-mass surface ratio may indicate stronger feedback, driving advective winds which rapidly remove injected CREs, leading to a flattening of the spectrum. Both findings are in agreement with what would be expected for galactic winds. Similarly to Tabatabaei et al. (2017), we found a correlation between SFR surface density within r★ and the spectral index. Heesen et al. (2022) did not find this relation. While Heesen et al. (2022) used the integrated spectral index, Tabatabaei et al. (2017) used the non-thermal spectral index and we used the spectral index of the thick disc. There might be absorption processes in the thin disc (Gajović et al. 2024), thereby obscuring this relation.
5. Conclusions
Cosmic rays and magnetic fields have a significant influence on the evolution and formation of galaxies. In order to understand the complex baryonic processes which regulate galaxy growth and evolution, the circumgalactic medium (CGM) is essential, as it hosts the key mechanisms of gas accretion, infall, phase transitions, and feedback that shape galaxy evolution. Radio continuum observations have been found valuable for probing the CGM (Heesen et al. 2023). Radio continuum observations of edge-on galaxies reveal two distinct discs. The thin disc, with a scale height of a few hundred parsec, consists mostly of stars, dust, and gas, while the thick disc contains ionized gas, cosmic rays, and magnetic fields (Ferrière 2001; Cox 2005). The latter, sometimes referred to as radio halo, may form the interface between the galaxy and the CGM, where both outflows and accretion may be observed.
We investigated the vertical structure and spectral properties of the thick radio discs in edge-on galaxies from the CHANG-ES survey, combining low-frequency LOFAR LoTSS data at 144 MHz with JVLA S band measurements at 3 GHz. We performed a two-component exponential fitting to the vertical intensity profiles to separate the thin and thick disc. For the thick disc, we measured scale height ratios and spectral index between 144 MHz and 3 GHz.
The comparison of scale heights reveals a mean ratio of 1.26 ± 0.16, with most galaxies falling below a ratio of 1.5. The highest ratio is found in NGC 4631 with 1.83 ± 0.23, while NGC 5907 shows a ratio close to unity with 0.98 ± 0.32, suggesting little frequency-dependent thickening. The mean spectral index of the thick disc is ⟨α2⟩= − 0.72 ± 0.09. This is fairly close to the injection spectral index, possibly suggesting a low degree of spectral aging with fast electron escape. We detected a flattening of the spectrum with increasing SFR-to-mass surface density ratio and tentative evidence for a flatting with SFR surface density. In addition we found a strong negative correlation between total mass and spectral index, namely, more massive galaxies show steeper spectra. The deeper gravitational potential may imply a better confinement of CREs and thereby increased spectral aging.
One motivation for our work was to further investigate the radio continuum scale heights in the sample of Heesen et al. (2025). In their work it was shown that the scale height depends strongly on the SFR-to-mass surface density ratio. This can be either explained by a hydrostatic equilibrium for an atmosphere, or a galactic wind. These two cases can be distinguished using the frequency dependence of the scale heights. A high SFR-to-mass surface density ratio could indicate strong feedback and winds, rapidly removing injected CREs. Alternatively, there could be the presence of a galactic fountain with an effective mixing of halo gas.
Our work offers some new insights. We find a moderate positive correlation between scale height ratio and spectral index. Galaxies with flat spectra and high ratios, such as NGC 3003, 4157, and 4631, are consistent with wind-driven cosmic-ray transport. Conversely, steep-spectrum systems, such as NGC 5907 appear calorimetric, with scale heights insensitive to frequency, pointing to strong confinement of cosmic rays. While this suggests a connection between scale height ratios and galactic winds, none of the fundamental galaxy properties examined show a significant correlation with the scale height ratio. This is in contrast to previously reported trends for absolute scale heights. However, the flattening radio continuum spectrum with SFR-to-mass surface density ratio is indicative of winds, removing CREs before they age.
The measured scale height ratios are much lower than expected for either cosmic ray diffusion or advection if synchrotron and inverse Compton radiation losses dominate. For advection, we would expect a ratio of ∼4.5 and for energy-independent diffusion a ratio of ∼2. It is only for for a strongly energy-dependent diffusion that we would obtain the correct scale height ratio. A plausible explanation for the low scale height ratios is that the CRE losses do not strongly depend on energy (as in the case of escape via advection or adiabatic losses). Both are present in the case of accelerating galactic winds (e.g. Heald et al. 2022).
Therefore, we conclude that scale height ratios may be indeed a good proxy for cosmic ray transport and, therefore, galactic winds. However, it is yet unclear what drives galactic winds since there is no clear correlation between scale height ratio and any fundamental galaxy parameter. The spectral index may offer some clues, but it is confused with many effects particularly at low frequencies. We might see an influence of cosmic ray ionization losses playing a role (Gajović et al. 2024) and low-frequency free-free absorption (Gajović et al. 2025). A flattening of spectra was also observed for global spectra in the gigahertz regime (Tabatabaei et al. 2017), which was interpreted as the influence of star formation on the CRE population. However, this was not observed in the global low frequency spectrum where no correlation between SFR surface density and spectral index was found (Heesen et al. 2022). The larger scale height of the radio continuum emission can be linked to a larger vertical scale height of the magnetic field or a larger scale height of CREs. The case of winds and CRE removal can be inferred via a flattening in the radio continuum spectrum, as demonstrated by Tabatabaei et al. (2017) and as we tentatively confirm in this work.
Our findings demonstrate that scale height ratios and spectral indices are powerful tracers of cosmic-ray transport in galactic halos. In the future, full radio SED modelling could help distinguish between different loss mechanisms and to enable testing of cosmic-ray transport models in a more more quantitative fashion.
Acknowledgments
We thank the anonymous referee for a concise and very helpful review. DCS was supported by ErUM-IFT. MB acknowledges funding by the Deutsche Forschungsgemeinschaft (DFG) under Germany’s Excellence Strategy – EXC 2121 “Quantum Universe” – 390833306 and the DFG Research Group “Relativistic Jets”. J.T.L. acknowledges the financial support from the China Manned Space Program with grant no. CMS-CSST-2025-A10 and CMS-CSST-2025-A04, and the National Science Foundation of China (NSFC) through the grants 12321003 and 12273111. TW acknowledges financial support from the grant CEX2021-001131-S funded by MICIU/AEI/ 10.13039/501100011033, from the coordination of the participation in SKA-SPAIN, funded by the Ministry of Science, Innovation and Universities (MICIU). This research made use of following software packages and other resources: Aladin sky atlas developed at CDS, Strasbourg Observatory, France (Bonnarel et al. 2000; Boch & Fernique 2014); ASTROPY (Astropy Collaboration 2013, 2018); HyperLeda (http://leda.univ-lyon1.fr; Makarov et al. 2014); NASA/IPAC Extragalactic Database (NED), which is operated by the Jet Propulsion Laboratory, California Institute of Technology, under contract with the National Aeronautics and Space Administration; SAOImage DS9 (Joye & Mandel 2003); and SCIPY (https://scipy.org; Virtanen et al. 2020).
References
- Astropy Collaboration (Price-Whelan, A. M., et al.) 2018, AJ, 156, 123 [Google Scholar]
- Astropy Collaboration (Robitaille, T. P., et al.) 2013, A&A, 558, A33 [NASA ADS] [CrossRef] [EDP Sciences] [Google Scholar]
- Boch, T., & Fernique, P. 2014, ASP Conf. Ser., 485, 277 [Google Scholar]
- Bonnarel, F., Fernique, P., Bienaymé, O., et al. 2000, A&AS, 143, 33 [NASA ADS] [CrossRef] [EDP Sciences] [Google Scholar]
- Boylan-Kolchin, M. 2023, Nat Astron, 7, 731 [Google Scholar]
- Buck, T., Pfrommer, C., Pakmor, R., Grand, R. J. J., & Springel, V. 2020, MNRAS, 497, 1712 [NASA ADS] [CrossRef] [Google Scholar]
- Cox, D. P. 2005, ARA&A, 43, 337 [Google Scholar]
- Dey, S., Goyal, A., Małek, K., & Díaz-Santos, T. 2024, ApJ, 966, 61 [Google Scholar]
- Dumke, M., Krause, M., Wielebinski, R., & Klein, U. 1995, A&A, 302, 691 [NASA ADS] [Google Scholar]
- Edler, H. W., Roberts, I. D., Boselli, A., et al. 2024, A&A, 683, A149 [NASA ADS] [CrossRef] [EDP Sciences] [Google Scholar]
- Ferrière, K. M. 2001, Rev. Modern Phys., 73, 1031 [CrossRef] [Google Scholar]
- Gajović, L., Adebahr, B., Basu, A., et al. 2024, A&A, 689, A68 [NASA ADS] [CrossRef] [EDP Sciences] [Google Scholar]
- Gajović, L., Heesen, V., Brüggen, M., et al. 2025, A&A, 695, A41 [NASA ADS] [CrossRef] [EDP Sciences] [Google Scholar]
- Galante, C. A., Saponara, J., Romero, G. E., & Benaglia, P. 2024, A&A, 685, A157 [NASA ADS] [CrossRef] [EDP Sciences] [Google Scholar]
- Galvin, T. J., Seymour, N., Marvil, J., et al. 2018, MNRAS, 474, 779 [Google Scholar]
- Girichidis, P., Naab, T., Hanasz, M., & Walch, S. 2018, MNRAS, 479, 3042 [NASA ADS] [CrossRef] [Google Scholar]
- Hafen, Z., Faucher-Giguère, C.-A., Anglés-Alcázar, D., et al. 2019, MNRAS, 488, 1248 [NASA ADS] [CrossRef] [Google Scholar]
- Heald, G. H., Heesen, V., Sridhar, S. S., et al. 2022, MNRAS, 509, 658 [Google Scholar]
- Heesen, V., Dettmar, R.-J., Krause, M., Beck, R., & Stein, Y. 2016, MNRAS, 458, 332 [NASA ADS] [CrossRef] [Google Scholar]
- Heesen, V., Staffehl, M., Basu, A., et al. 2022, A&A, 664, A83 [NASA ADS] [CrossRef] [EDP Sciences] [Google Scholar]
- Heesen, V., Klocke, T.-L., Brüggen, M., et al. 2023, A&A, 669, A8 [NASA ADS] [CrossRef] [EDP Sciences] [Google Scholar]
- Heesen, V., Wiegert, T., Irwin, J., et al. 2024, A&A, 691, A273 [NASA ADS] [CrossRef] [EDP Sciences] [Google Scholar]
- Heesen, V., Stein, M., Pourjafari, N., et al. 2025, A&A, 699, A243 [NASA ADS] [CrossRef] [EDP Sciences] [Google Scholar]
- Heintz, E., Bustard, C., & Zweibel, E. G. 2020, ApJ, 891, 157 [NASA ADS] [CrossRef] [Google Scholar]
- Henriksen, R. N. 2022, A&A, 658, A101 [NASA ADS] [CrossRef] [EDP Sciences] [Google Scholar]
- Hix, R. N., Armillotta, L., Ostriker, E., & Kim, C.-G. 2025, ApJ, 994, 45 [Google Scholar]
- Hummel, E., & Saikia, D. J. 1991, A&A, 249, 43 [NASA ADS] [Google Scholar]
- Irwin, J., Beck, R., Benjamin, R. A., et al. 2012, AJ, 144, 43 [Google Scholar]
- Irwin, J., Cook, T., Stein, M., et al. 2024, AJ, 168, 138 [NASA ADS] [CrossRef] [Google Scholar]
- Ji, S., Chan, T. K., Hummels, C. B., et al. 2020, MNRAS, 496, 4221 [NASA ADS] [CrossRef] [Google Scholar]
- Joye, W. A., & Mandel, E. 2003, ASP Conf. Ser., 295, 489 [Google Scholar]
- Klein, U., Lisenfeld, U., & Verley, S. 2018, A&A, 611, A55 [NASA ADS] [CrossRef] [EDP Sciences] [Google Scholar]
- Krause, M., Irwin, J., Wiegert, T., et al. 2018, A&A, 611, A72 [NASA ADS] [CrossRef] [EDP Sciences] [Google Scholar]
- Krause, M., Irwin, J., Schmidt, P., et al. 2020, A&A, 639, A112 [NASA ADS] [CrossRef] [EDP Sciences] [Google Scholar]
- Lacki, B. C., & Thompson, T. A. 2013, ApJ, 762, 29 [NASA ADS] [CrossRef] [Google Scholar]
- Li, J.-T., & Wang, Q. D. 2013, MNRAS, 428, 2085 [NASA ADS] [CrossRef] [Google Scholar]
- Li, J.-T., Lu, L.-Y., Qu, Z., et al. 2024a, ApJ, 967, 78 [NASA ADS] [CrossRef] [Google Scholar]
- Li, J.-T., Sun, W., Ji, L., & Yang, Y. 2024b, ApJ, 966, 239 [Google Scholar]
- Lisenfeld, U., & Völk, H. J. 2000, A&A, 354, 423 [NASA ADS] [Google Scholar]
- Lisenfeld, U., Voelk, H. J., & Xu, C. 1996, A&A, 306, 677 [Google Scholar]
- Longair, M. S. 2011, High Energy Astrophysics (Cambridge: Cambridge University Press) [Google Scholar]
- Lu, L.-Y., Li, J.-T., Vargas, C. J., et al. 2023, MNRAS, 519, 6098 [NASA ADS] [CrossRef] [Google Scholar]
- Makarov, D., Prugniel, P., Terekhova, N., Courtois, H., & Vauglin, I. 2014, A&A, 570, A13 [NASA ADS] [CrossRef] [EDP Sciences] [Google Scholar]
- Miskolczi, A., Heesen, V., Horellou, C., et al. 2019, A&A, 622, A9 [NASA ADS] [CrossRef] [EDP Sciences] [Google Scholar]
- Müller, P., Krause, M., Beck, R., & Schmidt, P. 2017, A&A, 606, A41 [NASA ADS] [CrossRef] [EDP Sciences] [Google Scholar]
- Mora-Partiarroyo, S. C., Krause, M., Basu, A., et al. 2019a, A&A, 632, A10 [NASA ADS] [EDP Sciences] [Google Scholar]
- Mora-Partiarroyo, S. C., Krause, M., Basu, A., et al. 2019b, A&A, 632, A11 [NASA ADS] [EDP Sciences] [Google Scholar]
- Mulcahy, D. D., Beck, R., & Heald, G. H. 2017, A&A, 600, A6 [NASA ADS] [CrossRef] [EDP Sciences] [Google Scholar]
- Ostriker, J. P., & Naab, T. 2012, Physics Today, 65, 43 [Google Scholar]
- Pakmor, R., van de Voort, F., Bieri, R., et al. 2020, MNRAS, 498, 3125 [NASA ADS] [CrossRef] [Google Scholar]
- Satyapal, S., Vega, D., Dudik, R. P., Abel, N. P., & Heckman, T. 2008, ApJ, 677, 926 [NASA ADS] [CrossRef] [Google Scholar]
- Schmidt, P., Krause, M., Heesen, V., et al. 2019, A&A, 632, A12 [NASA ADS] [EDP Sciences] [Google Scholar]
- Seabold, S., & Perktold, J. 2010, in Proceedings of the 9th Python in ScienceConference, Austin, Texas, 92 [Google Scholar]
- Shimwell, T. W., Hardcastle, M. J., Tasse, C., et al. 2022, A&A, 659, A1 [NASA ADS] [CrossRef] [EDP Sciences] [Google Scholar]
- Stein, Y., Dettmar, R.-J., Irwin, J., et al. 2019a, A&A, 623, A33 [NASA ADS] [CrossRef] [EDP Sciences] [Google Scholar]
- Stein, Y., Dettmar, R. J., Weügowiec, M., et al. 2019b, A&A, 632, A13 [NASA ADS] [CrossRef] [EDP Sciences] [Google Scholar]
- Stein, M., Heesen, V., Dettmar, R. J., et al. 2023, A&A, 670, A158 [NASA ADS] [CrossRef] [EDP Sciences] [Google Scholar]
- Stein, M., Kleimann, J., Adebahr, B., et al. 2025, A&A, 696, A112 [NASA ADS] [CrossRef] [EDP Sciences] [Google Scholar]
- Tabatabaei, F. S., Schinnerer, E., Krause, M., et al. 2017, ApJ, 836, 185 [Google Scholar]
- Thompson, T. A., & Heckman, T. M. 2024, ARA&A, 62, 529 [NASA ADS] [CrossRef] [Google Scholar]
- Tsukui, T., Wisnioski, E., Bland-Hawthorn, J., & Freeman, K. 2025, MNRAS, 540, 3493 [Google Scholar]
- Tumlinson, J., Peeples, M. S., & Werk, J. K. 2017, ARA&A, 55, 389 [Google Scholar]
- van de Voort, F., Bieri, R., Pakmor, R., et al. 2021, MNRAS, 501, 4888 [NASA ADS] [CrossRef] [Google Scholar]
- Van Haarlem, M. P., Wise, M. W., Gunst, A. W., et al. 2013, A&A, 556, A2 [NASA ADS] [CrossRef] [EDP Sciences] [Google Scholar]
- Vargas, C. J., Walterbos, R. A. M., Rand, R. J., et al. 2019, ApJ, 881, 26 [NASA ADS] [CrossRef] [Google Scholar]
- Virtanen, P., Gommers, R., Oliphant, T. E., et al. 2020, Nat. Methods, 17, 261 [Google Scholar]
- Weügowiec, M., Beck, R., Hanasz, M., et al. 2022, A&A, 665, A64 [Google Scholar]
- Wiegert, T., Irwin, J., Miskolczi, A., et al. 2015, AJ, 150, 81 [Google Scholar]
- Zschaechner, L. K., Rand, R. J., & Walterbos, R. 2015, ApJ, 799, 61 [NASA ADS] [CrossRef] [Google Scholar]
Appendix A: Galaxy sample
In Table A.1 we present the scale height ratio, the spectral index and the properties of our sample galaxies.
Properties of the galaxies in the sample
Table A.2 lists the Spearman correlation coefficients between the spectral index α2 and the scale height ratio with several galaxy properties. The table provides both the correlation coefficient ρs and the corresponding p-value for each comparison. The data used to calculate these correlations are displayed in Figures 4 and 6.
Spearman correlation coefficients between galaxy properties.
All Tables
All Figures
|
Fig. 1. Vertical radio continuum intensity profiles at 144 MHz of the galaxies in our sample. The intensity profiles of the central strip are given for each galaxy, with the exception of NGC 2820 and 4388 (where the profile in the eastern strip is shown). Left: Profiles in units of arcsec, the right panel shows them in units of kpc in projection of the assumed distances. Solid lines represent two-component exponential model profiles after deconvolution with the effective beam. The intensities were rescaled arbitrarily to separate the profiles for clearer visualization. |
| In the text | |
|
Fig. 2. Location of the strips and boxes used for fitting vertical radio continuum intensity profiles overlaid on the LOFAR map of NGC 891. The red lines denote the measured scale heights of the thick disc for each strip, the blue lines denote the measured scale heights of the thin disc for each strip. We use three strips with a width in terms of the effective radius re of 2/3 re. For NGC 891, we calculate the average intensity in 60 boxes per strip, each box with a height of 3″, corresponding to approximately half of our angular resolution. |
| In the text | |
|
Fig. 3. Ratio of scale heights of LOFAR observations at 144 MHz and VLA S band observations with errors for all galaxies of the sample. The dotted black line indicates the mean scale height ratio of the galaxies in the sample. |
| In the text | |
|
Fig. 4. Scale height ratio plotted against different galaxy properties. The panels show the scale height ratio versus total mass (Makarov et al. 2014), star forming radius(Wiegert et al. 2015), SFR surface density within r★ (Heesen et al. 2025), total mass surface density scaled to our distances (Irwin et al. 2012), ratio of SFR-to-mass surface density, and SFR from Hα and mid-infrared (Vargas et al. 2019). Data points represent the galaxies in our sample with their associated uncertainties. |
| In the text | |
|
Fig. 5. Spectral index of the thick disc measured between LOFAR observations at 144 MHz and VLA S band observations with errors for all galaxies of the sample. The red line represents the mean spectral index of the galaxy sample. The yellow points represent the measured spectral index in the different strips. The blue points (with error bars) denote the inverse-variance-weighted mean per strip and its standard error. |
| In the text | |
|
Fig. 6. Spectral index of the thick disc plotted against different galaxy properties. The panels show the spectral index versus total mass (Makarov et al. 2014), star forming radius (Wiegert et al. 2015), SFR surface density within r★ (Heesen et al. 2025), total mass surface density scaled to our distances (Irwin et al. 2012), ratio of SFR-to-mass surface density, and SFR from Hα and mid-infrared (Vargas et al. 2019). Data points represent the galaxies in our sample with their associated uncertainties. |
| In the text | |
|
Fig. 7. Scale height ratio plotted against the spectral index of the thick disc measured between LOFAR and VLA S band data. Squares indicate the variance-weighted mean of all strips for each galaxy with the corresponding error bar, while dots show the individual strip measurements (errors omitted for clarity). The black circles indicate the central stip of the galaxy. If northern and southern halo are fittet individually, there are two central strips for the corresponding galaxy and both are indicated in this plot. |
| In the text | |
Current usage metrics show cumulative count of Article Views (full-text article views including HTML views, PDF and ePub downloads, according to the available data) and Abstracts Views on Vision4Press platform.
Data correspond to usage on the plateform after 2015. The current usage metrics is available 48-96 hours after online publication and is updated daily on week days.
Initial download of the metrics may take a while.