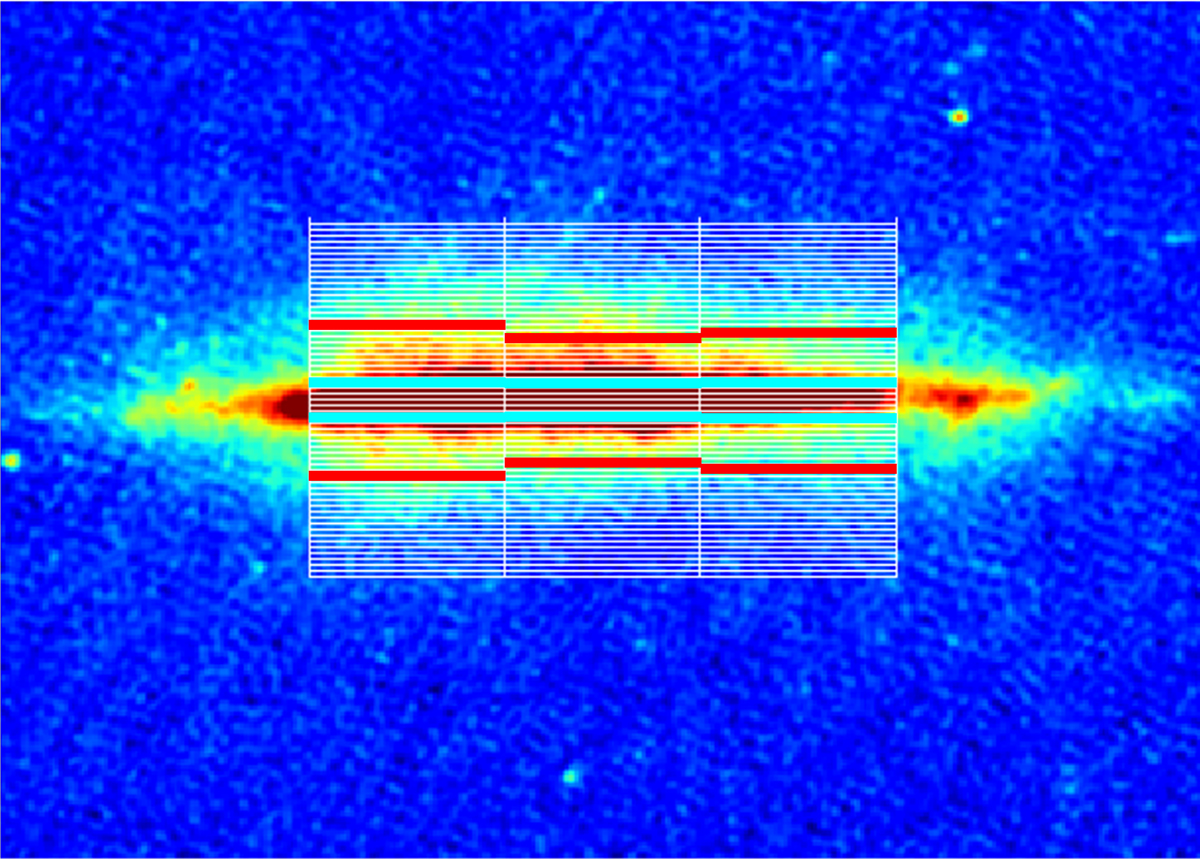
Fig. 2.
Download original image
Location of the strips and boxes used for fitting vertical radio continuum intensity profiles overlaid on the LOFAR map of NGC 891. The red lines denote the measured scale heights of the thick disc for each strip, the blue lines denote the measured scale heights of the thin disc for each strip. We use three strips with a width in terms of the effective radius re of 2/3 re. For NGC 891, we calculate the average intensity in 60 boxes per strip, each box with a height of 3″, corresponding to approximately half of our angular resolution.
Current usage metrics show cumulative count of Article Views (full-text article views including HTML views, PDF and ePub downloads, according to the available data) and Abstracts Views on Vision4Press platform.
Data correspond to usage on the plateform after 2015. The current usage metrics is available 48-96 hours after online publication and is updated daily on week days.
Initial download of the metrics may take a while.