Fig. 5.
Download original image
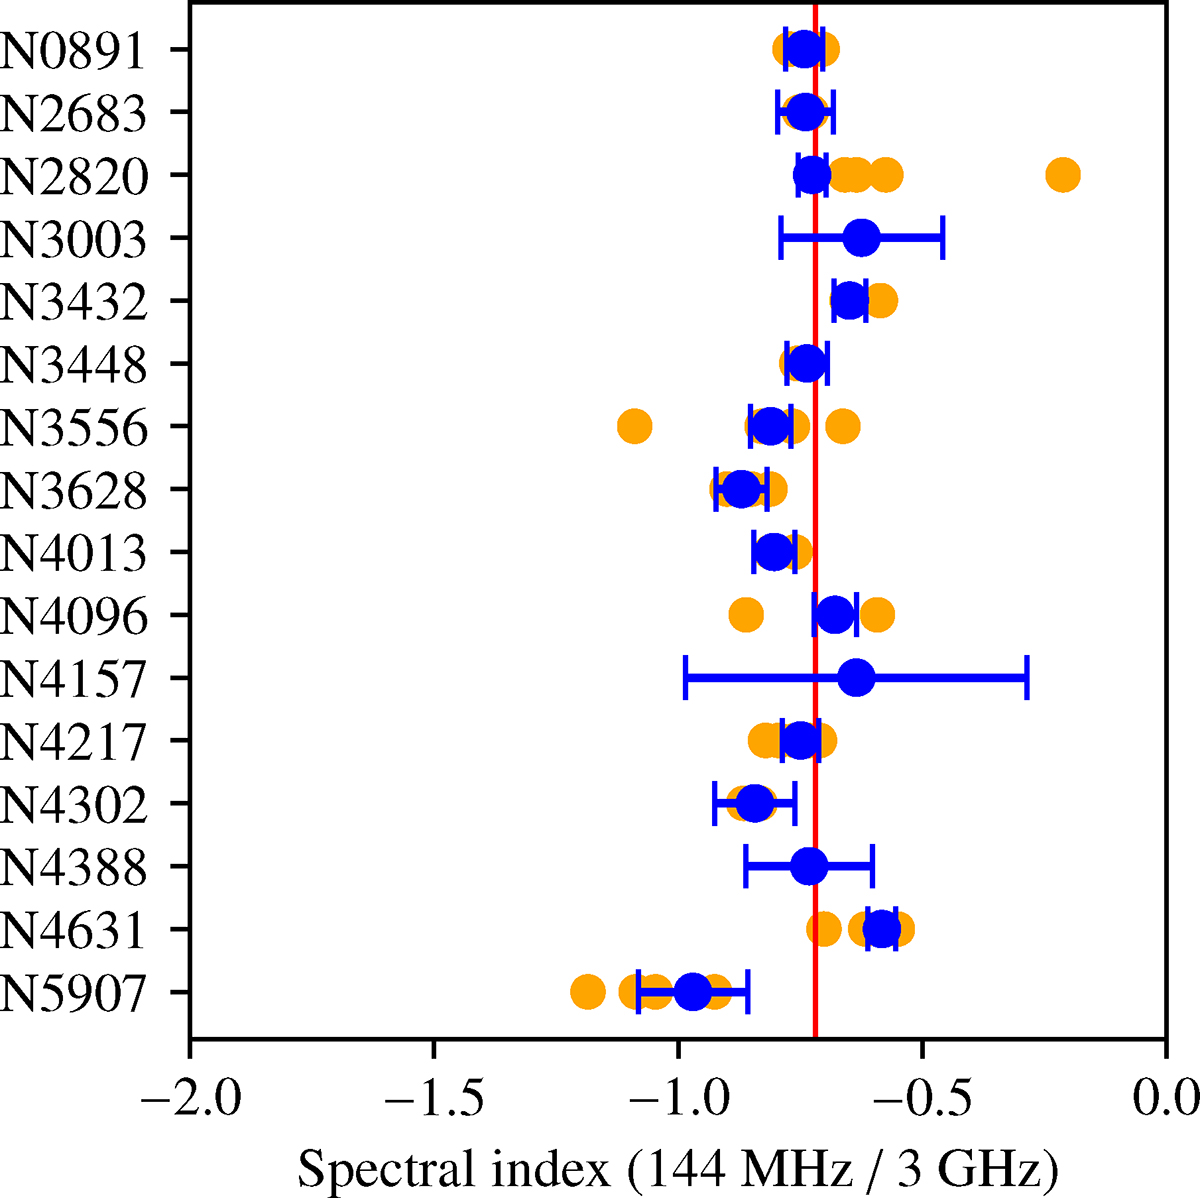
Spectral index of the thick disc measured between LOFAR observations at 144 MHz and VLA S band observations with errors for all galaxies of the sample. The red line represents the mean spectral index of the galaxy sample. The yellow points represent the measured spectral index in the different strips. The blue points (with error bars) denote the inverse-variance-weighted mean per strip and its standard error.
Current usage metrics show cumulative count of Article Views (full-text article views including HTML views, PDF and ePub downloads, according to the available data) and Abstracts Views on Vision4Press platform.
Data correspond to usage on the plateform after 2015. The current usage metrics is available 48-96 hours after online publication and is updated daily on week days.
Initial download of the metrics may take a while.