Fig. 6.
Download original image
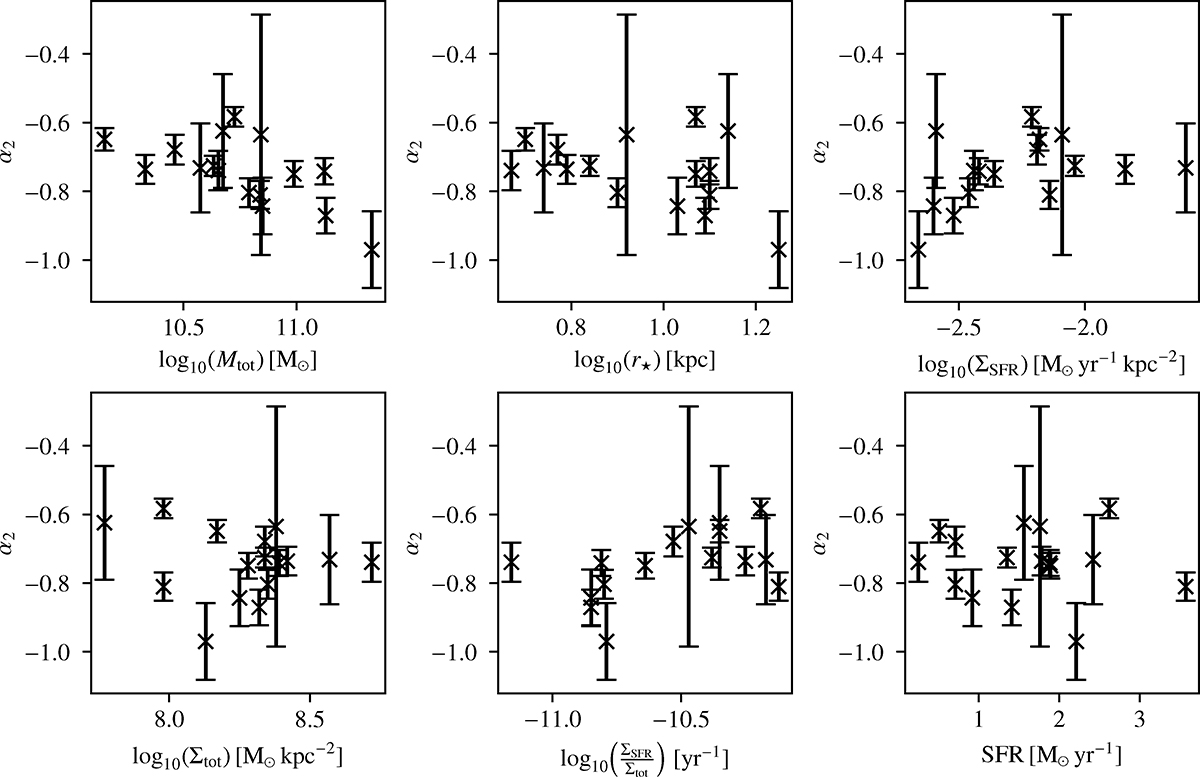
Spectral index of the thick disc plotted against different galaxy properties. The panels show the spectral index versus total mass (Makarov et al. 2014), star forming radius (Wiegert et al. 2015), SFR surface density within r★ (Heesen et al. 2025), total mass surface density scaled to our distances (Irwin et al. 2012), ratio of SFR-to-mass surface density, and SFR from Hα and mid-infrared (Vargas et al. 2019). Data points represent the galaxies in our sample with their associated uncertainties.
Current usage metrics show cumulative count of Article Views (full-text article views including HTML views, PDF and ePub downloads, according to the available data) and Abstracts Views on Vision4Press platform.
Data correspond to usage on the plateform after 2015. The current usage metrics is available 48-96 hours after online publication and is updated daily on week days.
Initial download of the metrics may take a while.