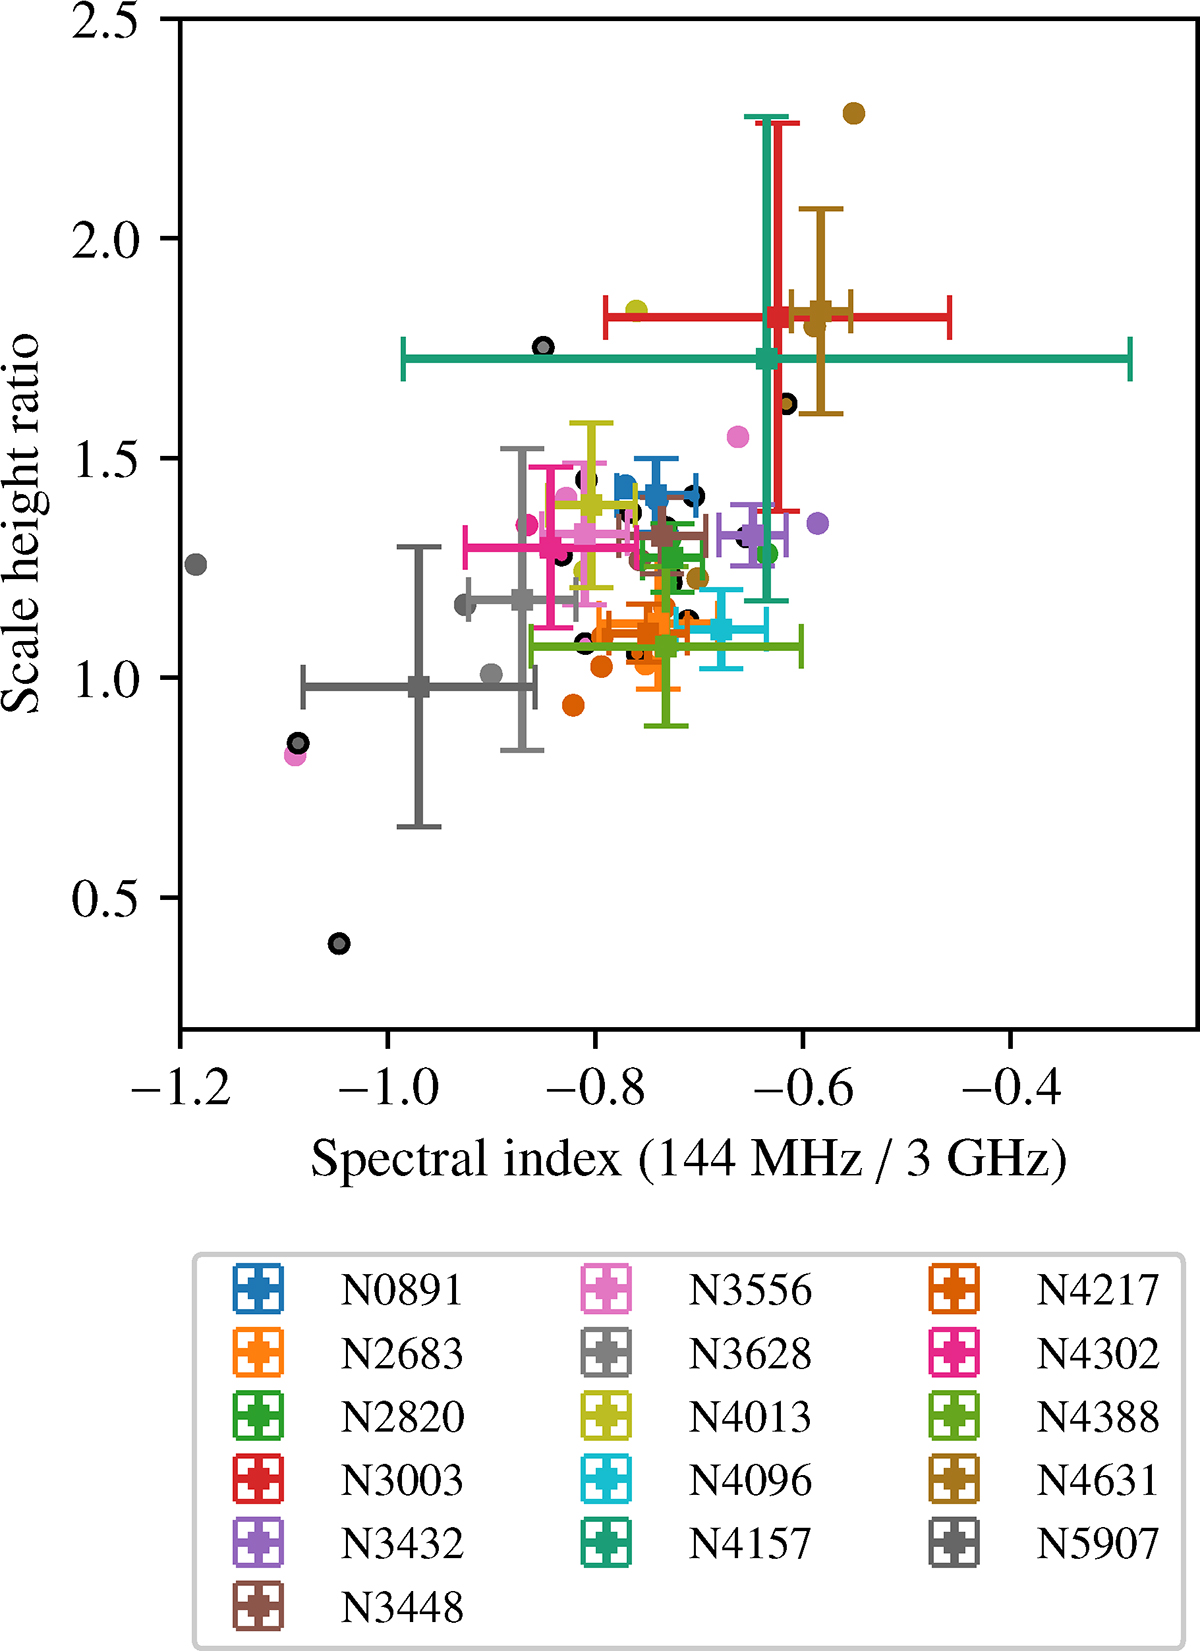
Fig. 7.
Download original image
Scale height ratio plotted against the spectral index of the thick disc measured between LOFAR and VLA S band data. Squares indicate the variance-weighted mean of all strips for each galaxy with the corresponding error bar, while dots show the individual strip measurements (errors omitted for clarity). The black circles indicate the central stip of the galaxy. If northern and southern halo are fittet individually, there are two central strips for the corresponding galaxy and both are indicated in this plot.
Current usage metrics show cumulative count of Article Views (full-text article views including HTML views, PDF and ePub downloads, according to the available data) and Abstracts Views on Vision4Press platform.
Data correspond to usage on the plateform after 2015. The current usage metrics is available 48-96 hours after online publication and is updated daily on week days.
Initial download of the metrics may take a while.