Open Access
Fig. 1
Download original image
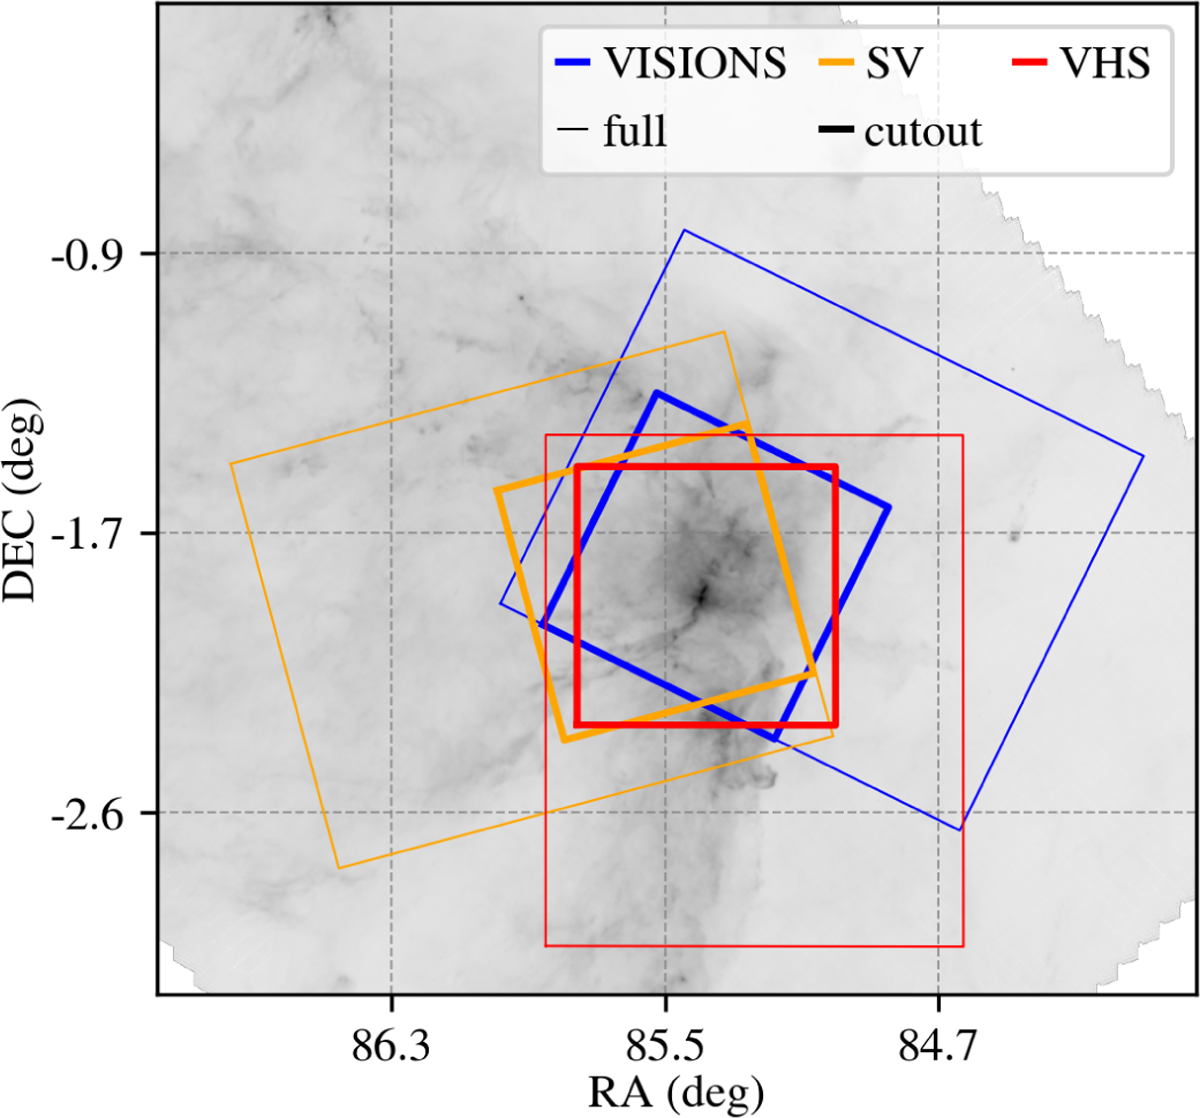
Outlines of the SV, VHS, and VISIONS tiles covering the Flame Nebula, plotted over the Herschel Gould Belt Survey 350 μm emission map. The bold squares show the cutouts used in this study. The varying tile orientations result from the survey-specific observing strategies.
Current usage metrics show cumulative count of Article Views (full-text article views including HTML views, PDF and ePub downloads, according to the available data) and Abstracts Views on Vision4Press platform.
Data correspond to usage on the plateform after 2015. The current usage metrics is available 48-96 hours after online publication and is updated daily on week days.
Initial download of the metrics may take a while.