Open Access
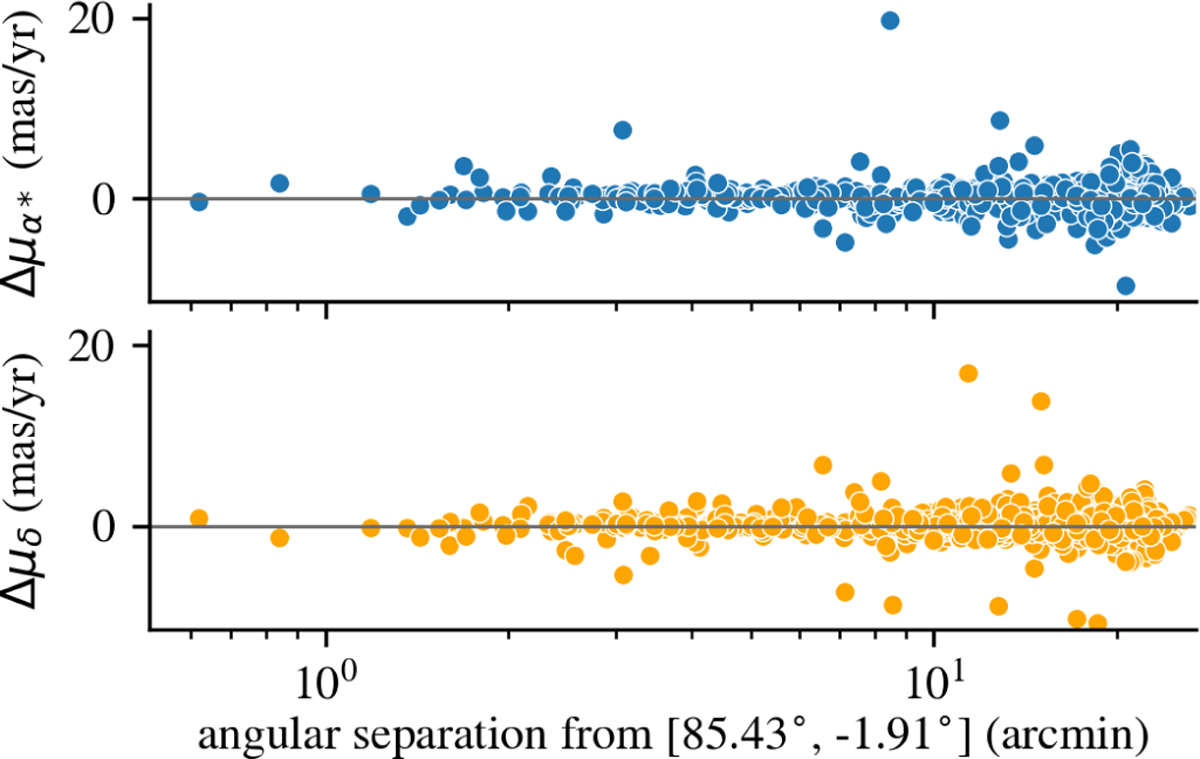
Fig. 6
Download original image
Difference between Gaia and infrared proper motions vs. angular distance from the projected cluster center. The log-scale of the x-axis highlights the lack of Gaia sources near the center.
Current usage metrics show cumulative count of Article Views (full-text article views including HTML views, PDF and ePub downloads, according to the available data) and Abstracts Views on Vision4Press platform.
Data correspond to usage on the plateform after 2015. The current usage metrics is available 48-96 hours after online publication and is updated daily on week days.
Initial download of the metrics may take a while.