Fig. 9
Download original image
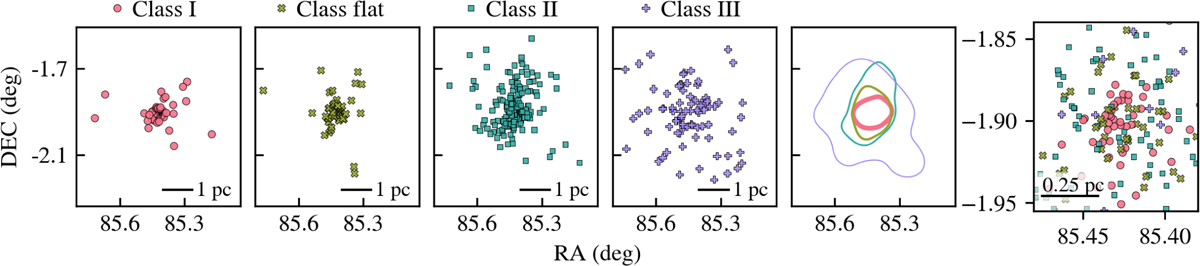
Panels 1-4: positions of the identified YSO candidates, separated by evolutionary class. Panel 5: kernel density estimates (KDEs) at the 25% contour level. Panel 6: zoomed-in image of the cluster center. The contour linewidths decrease with increasing evolutionary stage, reflecting the YSO classes ordered by age. The scale bars are given for a distance d ~ 420 pc.
Current usage metrics show cumulative count of Article Views (full-text article views including HTML views, PDF and ePub downloads, according to the available data) and Abstracts Views on Vision4Press platform.
Data correspond to usage on the plateform after 2015. The current usage metrics is available 48-96 hours after online publication and is updated daily on week days.
Initial download of the metrics may take a while.