Fig. 5.
Download original image
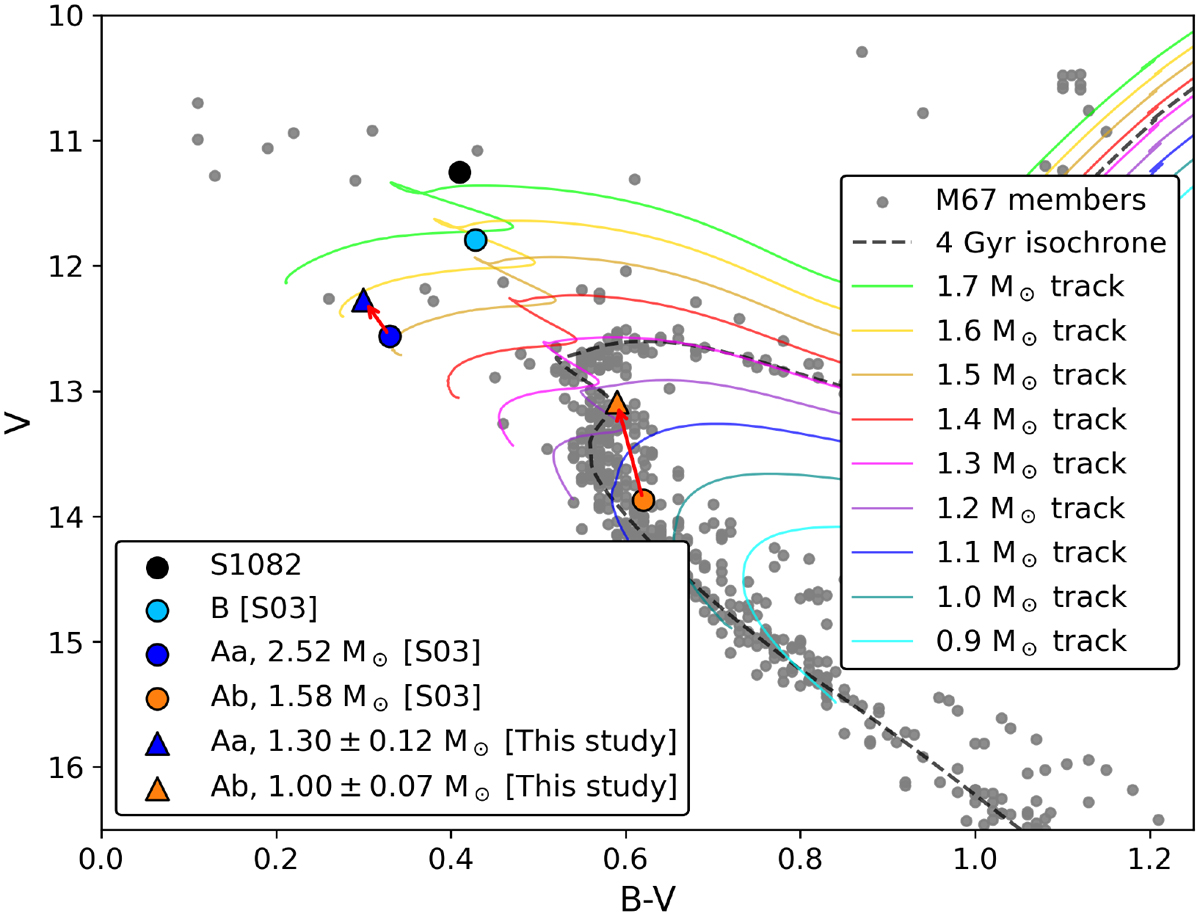
CMD of M67 showing the positions of the components of S1082. Gray points are confirmed cluster members from Geller et al. (2015b). A 4.0 Gyr MIST isochrone (dashed black line; 850 pc, AV = 0.093, solar metallicity) and single–star evolutionary tracks from 0.9–1.7 M⊙ are overplotted. Circles mark the component positions from Sandquist et al. (2003), while triangles show the updated values derived in this study (blue: Aa, 1.30 ± 0.13 M⊙, orange: Ab, 1.00 ± 0.07 M⊙). Red arrows mark the shifts from the earlier estimates to the new ones.
Current usage metrics show cumulative count of Article Views (full-text article views including HTML views, PDF and ePub downloads, according to the available data) and Abstracts Views on Vision4Press platform.
Data correspond to usage on the plateform after 2015. The current usage metrics is available 48-96 hours after online publication and is updated daily on week days.
Initial download of the metrics may take a while.