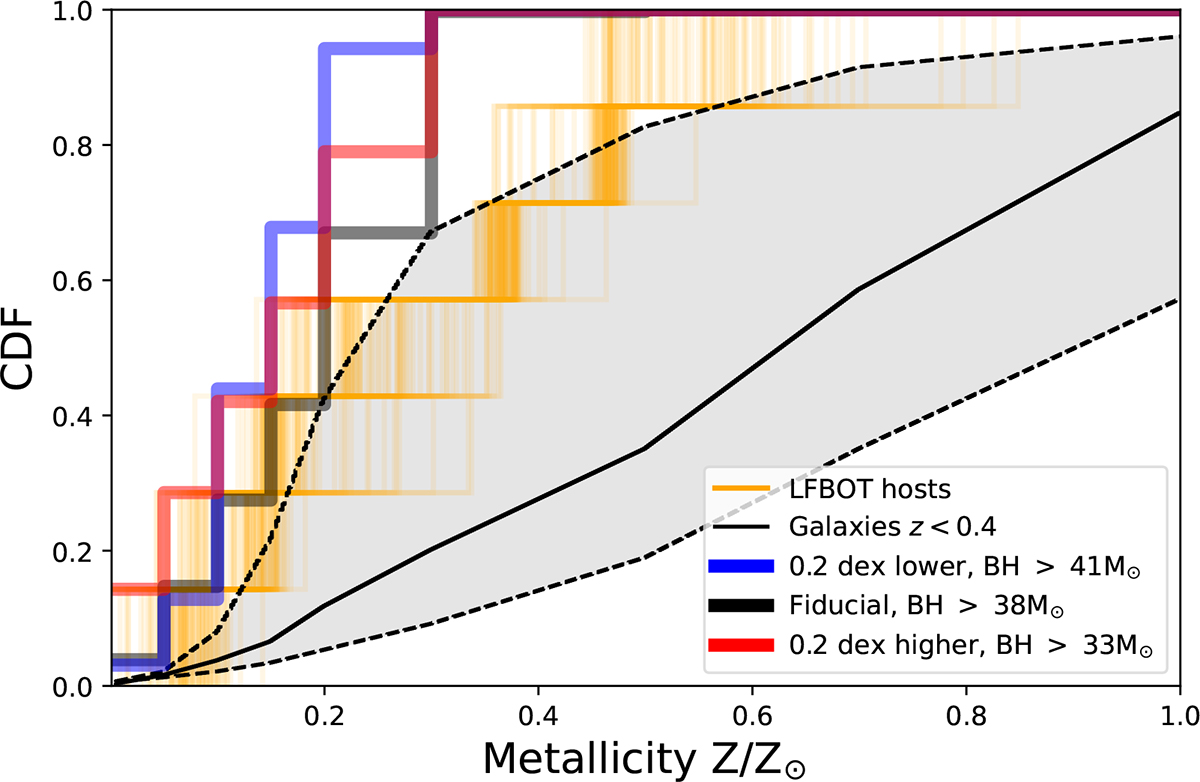
Fig. 2.
Download original image
Cumulative distribution of LFBOT host galaxy metallicities is shown in orange (see Table 1). We sample the Z values, assuming Gaussian uncertainties, 100 times, producing the many realisations of the cumulative distribution shown. Cumulative distributions of our selected progenitor metallicities, weighted by the CSFH(Z) at z < 0.4, are also shown. The black line is the z < 0.4 mean metallicity distribution of star-forming galaxies Langer & Norman (2006). The grey shaded region bounded by dashed lines is defined by shifting the distribution of Langer & Norman (2006) by ±0.2 in 12+log10(OH), covering the high- and low-Z extremes defined by Chruslinska & Nelemans (2019).
Current usage metrics show cumulative count of Article Views (full-text article views including HTML views, PDF and ePub downloads, according to the available data) and Abstracts Views on Vision4Press platform.
Data correspond to usage on the plateform after 2015. The current usage metrics is available 48-96 hours after online publication and is updated daily on week days.
Initial download of the metrics may take a while.