Fig. 6.
Download original image
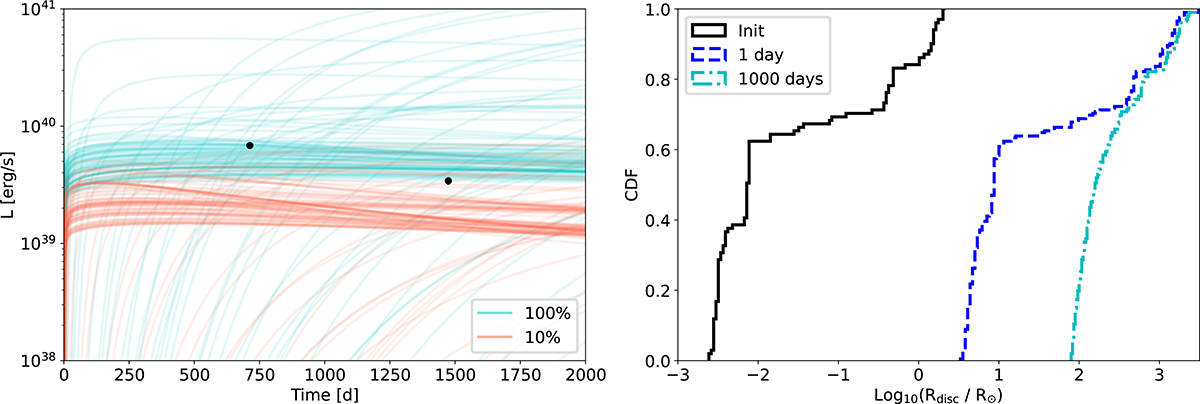
Left: Predictions for UV light curves arising from the accretion disc around natal BHs of mass greater than 38 M⊙ in our failed SN models, using the model of Mummery & Balbus (2020), Mummery et al. (2025). These predictions are for observations in the Hubble Space Telescope WFC3/F225W filter; the black points are late-time F225W observations of AT 2018cow (Inkenhaag et al. 2023). Two example cases are shown: one assuming that 10% of the total pre-collapse angular momentum and 10% of the leftover mass, goes into the disc (red). The other is the extreme case that 100% of the available angular momentum and mass goes into the disc (cyan). Both scenarios adopt progenitor rotation at 10% of the critical velocity. The large spread in luminosity in both the cyan and red curves is due to the spread in BH and leftover masses (spanning the pair instability mass gap, see Figure 4). Right: Disc radii for the fiducial selected models at t = 0, 1, and 1000 days. The radii are the same for both the 10% and 100% assumptions (see Equation 1). The discs spread rapidly, with around 40% of them reaching radii of 30–40 R⊙ within the first day (the scale inferred from blackbody modelling of LFBOT observations). All discs ultimately reach 100–1000 R⊙ by 1000 days.
Current usage metrics show cumulative count of Article Views (full-text article views including HTML views, PDF and ePub downloads, according to the available data) and Abstracts Views on Vision4Press platform.
Data correspond to usage on the plateform after 2015. The current usage metrics is available 48-96 hours after online publication and is updated daily on week days.
Initial download of the metrics may take a while.